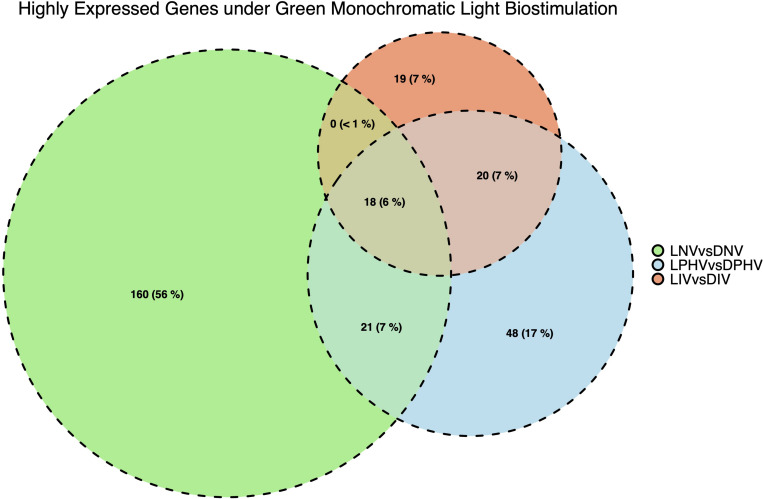
FIGURE 5.
Number and overlapping DEGs in spleen tissues between pre-hatch (LNV vs. DNV) and post-hatch (LPHV vs. DPHV and LIV vs. DIV) treatments, stimulated by green monochromatic light during incubation. The DEGs were determined by statistical algorithms EdgeR. Notably, embryonic spleen samples had a greater number of highly expressed DEGs (FDR < 0.05) compared to post-hatch spleen samples indicating the dilution of biostimulation in the post-hatch environment (shift to standard lighting).

