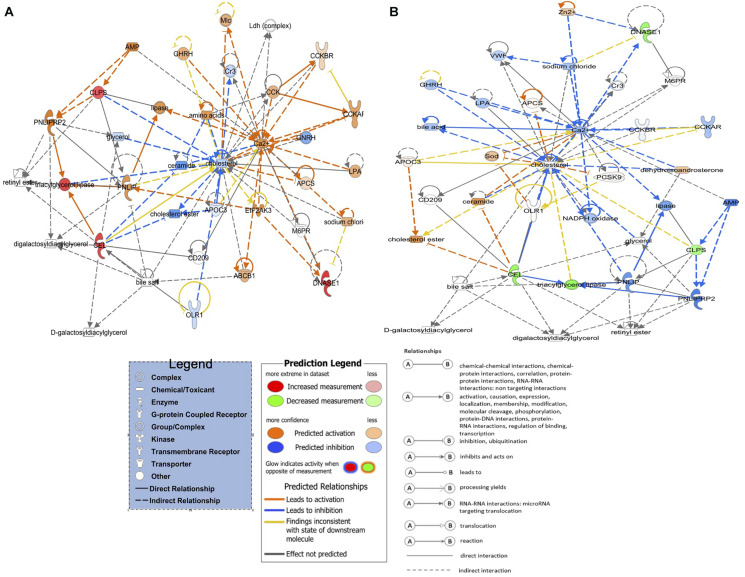
FIGURE 6.
Activated and inhibited lipid metabolism networks in the green light biostimulation comparisons underline the role of green monochromatic light biostimulation regulating developmental biological processes pre- and post-hatch. (A) LNV vs. DNV and LPHV vs. DPHV gene network activated lipid metabolism. (B) LIV vs. DIV gene network for inhibited lipid metabolism. Genes highlighted in red were upregulated, while those highlighted in green were downregulated in all biostimulated comparisons.

