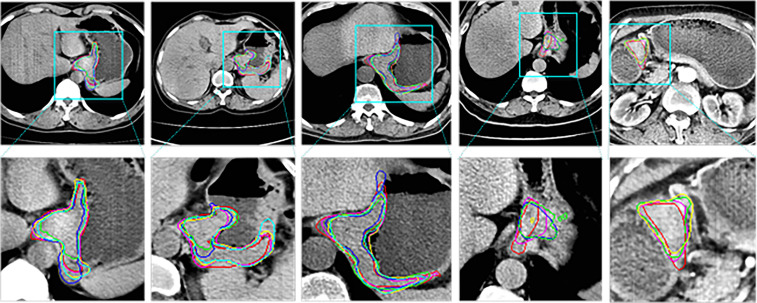
Figure 4.
2D visual comparisons of segmented slices from 3D CT volumes. Up row, CT slicers with red boxes to indicate the tumor areas; Down row, ground truth (red) delineated by experienced radiologists and corresponding segmented tumor contours using 3D U-Net (10) (blue), nnU-Net (32) (green), DAF3D (14) (cyan), 3D FPN (12) (yellow) and our method (purple).

