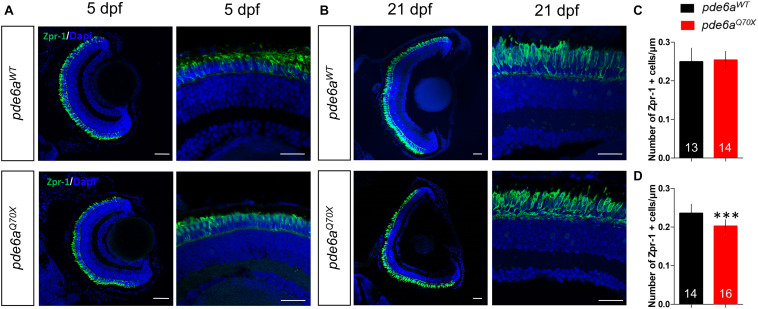
FIGURE 7.
Analysis of cones in pde6aQ70X zebrafish during development. Representative confocal images of the retina of pde6aWT and pde6aQ70X zebrafish obtained after immunostaining of cones with a Zpr-1 antibody (green) at 5 dpf (A) and 21 dpf (B). Nuclei were highlighted with DAPI (blue). Scale bar = 30 μm. (C,D) Quantification of the number of cones normalized against the length of the retinal section, based on three independent measurements of larvae per group at 5 dpf (C) and 21 dpf (D). The number of animals is indicated within the columns. ∗∗∗p < 0.001.

