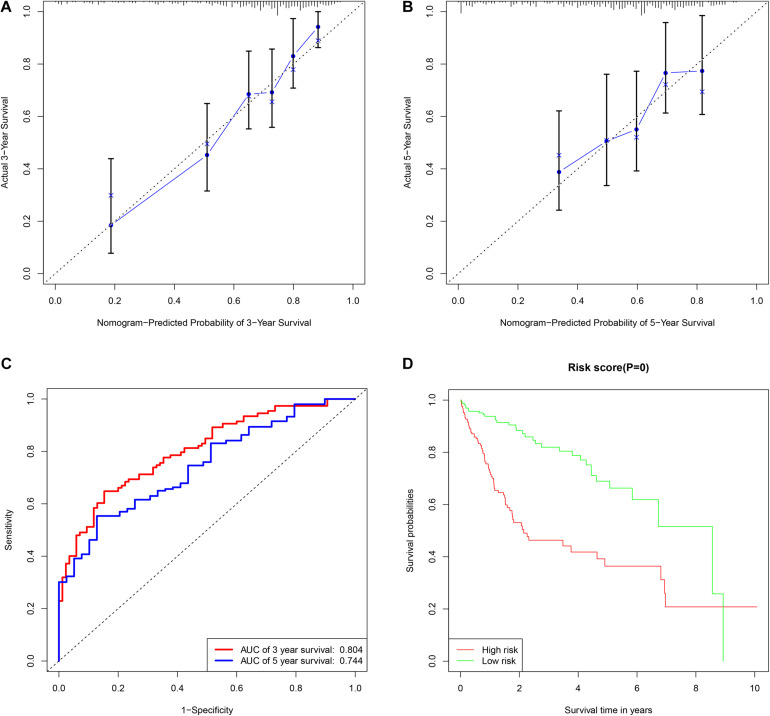
FIGURE 4.
The assessment of miRNAs-based clinical prediction model. The calibration curves according to nomogram model to estimate the survival rate at 3-year (A) and 5-year (B), the X and Y-axis represent predicted and actual survival time respectively. The efficacy of prognostic model of 3- and 5-years survival rate based on time dependent receiver operated characteristic curves (C). The Kaplan-Meier curve of overall survival time between the high- and low- risk groups stratified by the mean of total risk scores (D).

