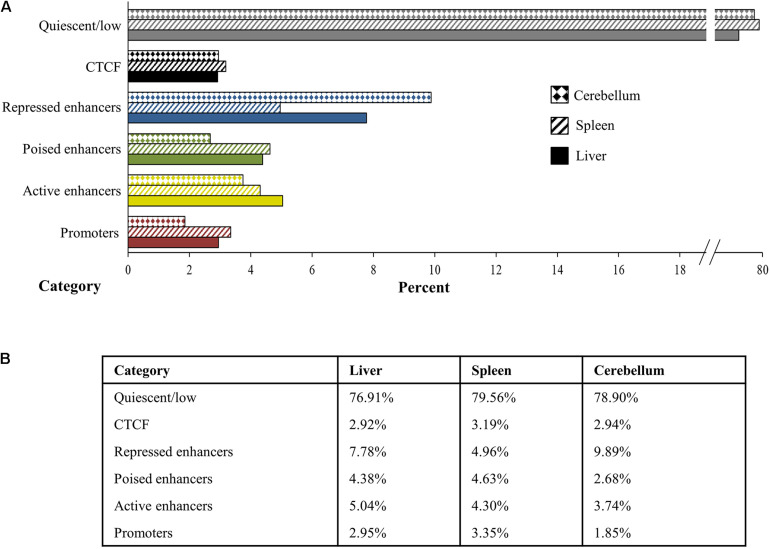
FIGURE 7.
Percent of the genome in the liver, spleen, and cerebellum (from M1 and M2) assigned to each category of quiescent/low (gray), CTCF (black), repressed enhancer (blue), poised enhancer (green), active enhancer (gold), and promoter (red) depicted visually in panel (A) the bar graph and numerically in panel (B) the table.

