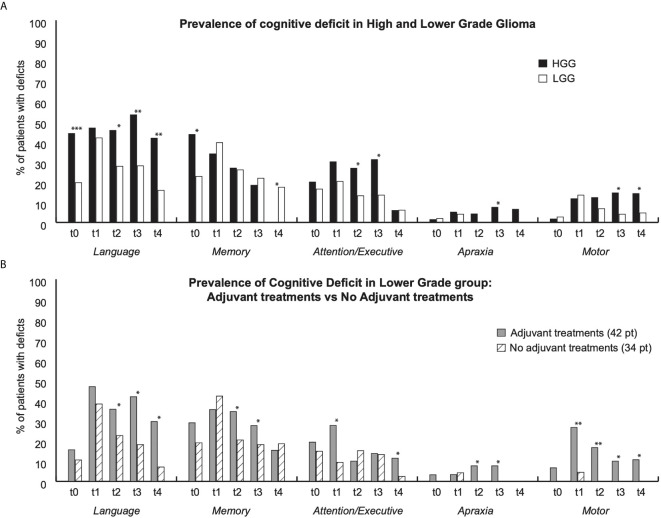
Figure 1.
Figure shows prevalence of functional deficits for each group and for each time points (t0: pre surgery; t1:1month after surgery; t2: 3 months after surgery; t3: 6 months after surgery; t4: 12 months after surgery). (A) Prevalence of deficit in High Grade glioma (HGG) (Black bars) and in lower grade (White Bars); (B) Prevalence of deficits in Lower patients who underwent adjuvant treatments (grey bars) vs patients who did not undergo adjuvant treatment (white dashed bars). * indicate p < 0,05; ** p < 0,01; *** p < 0.001.

