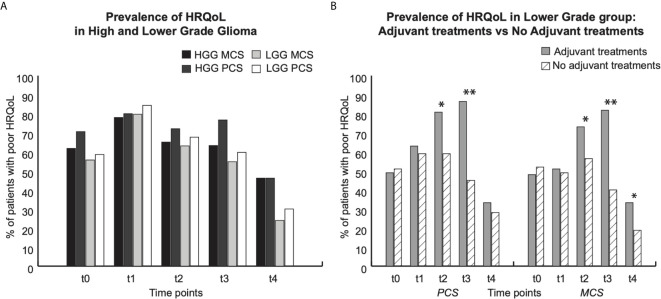
Figure 3.
Prevalence of low HRQoL (SF36 score). For each group, graphs show data at each time point: t0 (pre surgery); t1 (1 month after surgery); t2, t3 and t4 (respectively 3, 6 and 12 months after surgery). * indicate p < 0,05; ** p < 0,01. (A) Prevalence of low HRQoL in High (black and dark grey bars) and Lower (light grey and white bras) group. Dark Black and light grey bars show prevalence of Mental component score (MCS); light black and white bars show prevalence of Physical component score (PCS). (B) Prevalence of low HRQoL in lower grade group: Grey bars patients who underwent adjuvant treatments, dashed white bars: patients who did not undergo adjuvant treatments.

