Figure 1.

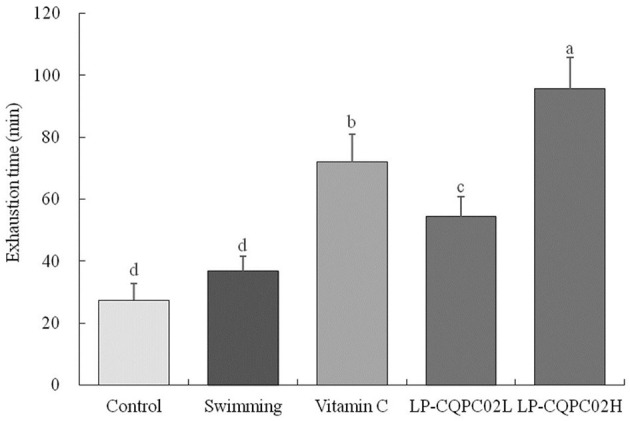
Swimming exhaustion time of mouse in each group. “±” for standard deviation. a−dAfter the Tukey's honestly significantly different test analysis, there is significant difference between the two groups with different superscript (P < 0.05).

Swimming exhaustion time of mouse in each group. “±” for standard deviation. a−dAfter the Tukey's honestly significantly different test analysis, there is significant difference between the two groups with different superscript (P < 0.05).