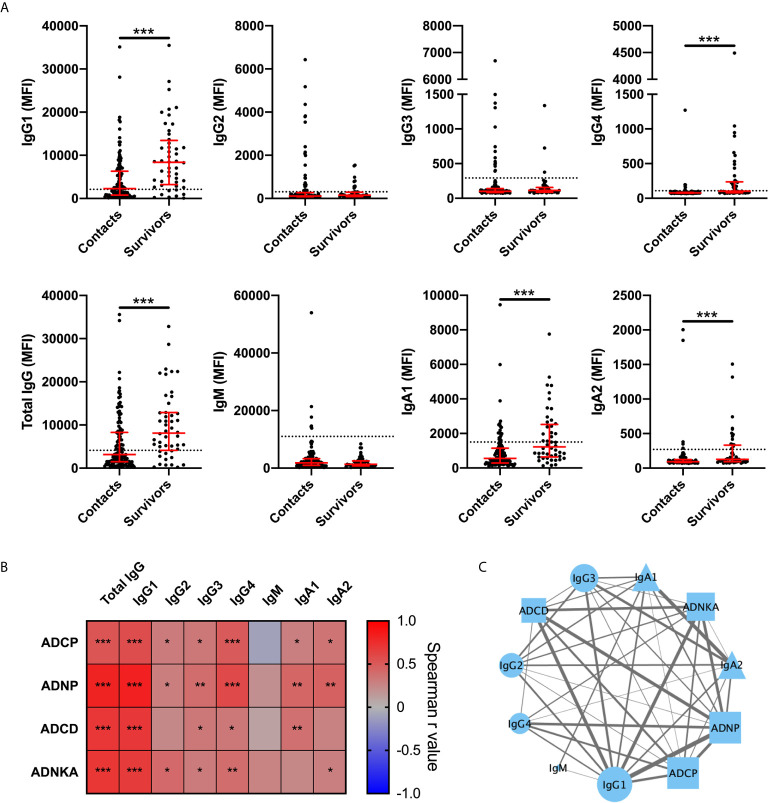
Figure 2.
GP specific IgG1 levels are strongly associated with antibody effector functions in BDBV survivors. Levels of BDBV GP specific IgG1, IgG2, IgG3, IgG4, total IgG, IgM, IgA1, and IgA2 in plasma of BDBV survivors (n=48) and household contacts (n=121) (A). The line and whiskers represent the median and interquartile range respectively. The dotted line represents the cutoff for positivity. Heatmap showing the associations between antibody subclasses or isotypes and antibody effector functions (B). Correlation network analysis of statistically significant associations (p < 0.05) between GP-specific functional activity and levels of GP-specific antibody levels (C). The strength of correlation is indicated by the weight of the connecting line and the number of significant associations for each feature is represented by the size of the icon. IgG and IgA subclasses are represented by circles and triangles respectively. IgM is represented by a diamond and Fc-mediated functions are represented by squares. *** represents p values < 0.001, ** represents p values < 0.01, and * represents p values < 0.05.

