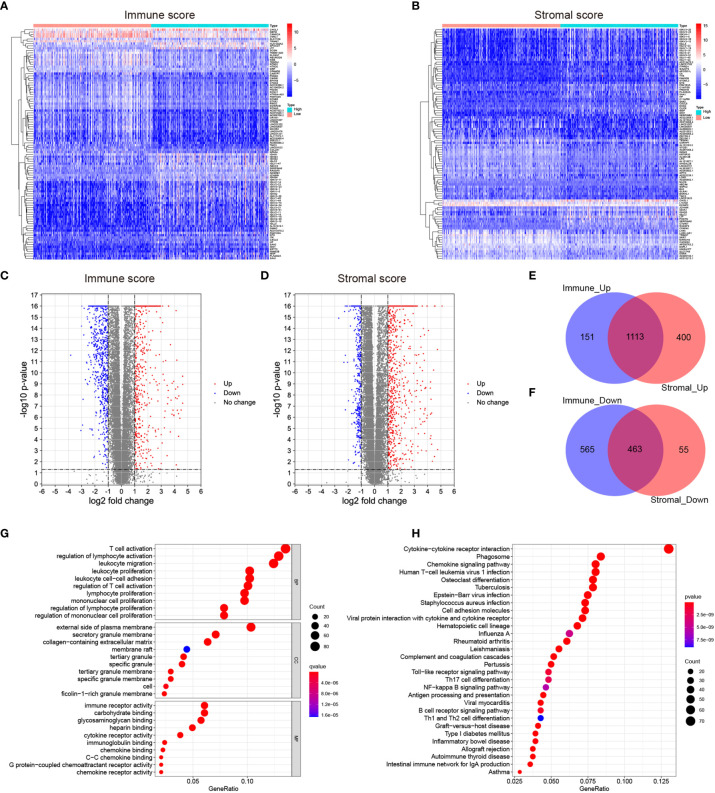
Figure 2.
Identification of the differentially expressed genes (DEGs) based on the immune and stromal scores of the LGGs. (A, B) Heatmaps showing the distribution patterns of differentially expressed genes based on immune and stromal scores. The darker the red color, the higher the gene expression was. The deeper the blue color, the lower the gene expression was. (C, D) Volcano plots of significantly differentially expressed genes based on immune and stromal scores (|lg FC|>1, p < 0.05). Blue dots represented significantly down-regulated genes, and red dots represented significantly up-regulated genes. (E, F) Venn plots showing the overlapping DEGs between immune and stromal groups. (G) Bubble plot of GO enrichment analysis of DEGs. (H) Bubble plot of KEGG enrichment analysis of DEGs. Node size represented the number of DEGs contained in the corresponding GO/KEGG term, and the node color denoted the p-value. P-value<0.05 was considered statistically significant.

