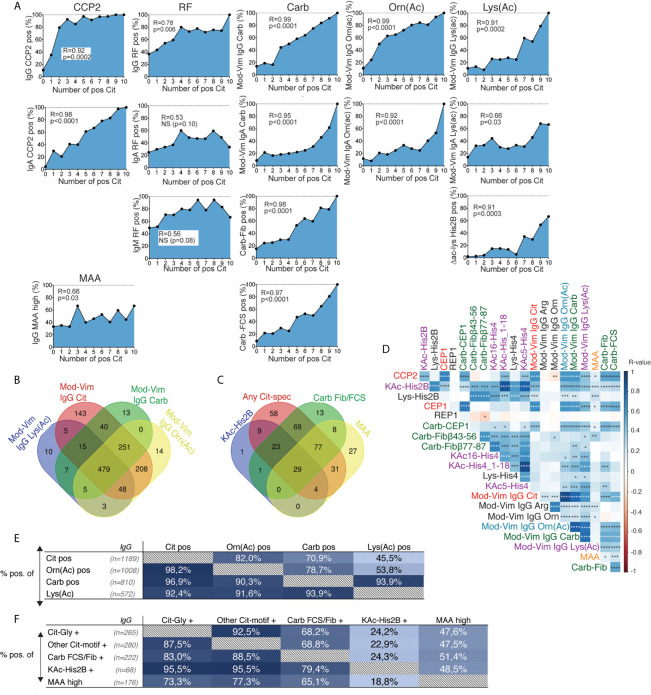
Figure 5.
Correlation between different IgG AMPA reactivities in RA. (A) Correlation of the frequency of autoantibody positivity with the number of IgG ACPA fine-specificities by autoantigen microarray screening (based on 10 Cit-peptides) in 402 RA patients. P-values and R-values are presented from Spearman correlation. (B) Venn diagram for positivity in the mod-Vim assays among 1984 RA patients (C) Venn diagram for positivity among other IgG AMPA reactivities in 393 RA patients. (D) Kendall correlation matrix for continuous measures of serum antibody levels in different AMPA tests and control assays (in 80-402 RA patients). *p < 0.05, **p < 0.01, ***p < 0.001, ****p < 0.0001. Red color represents a negative R-value and blue color represents a positive R-value. (E) Distribution of mod-Vim IgG AMPA assay positivity among 1984 RA patients. (F) Distribution of AMPA assay positivity among 402 RA patients comparing: Cit-peptide reactivity (any positivity among six peptides with the Cit-Gly motif, any positivity among four peptides with other Cit-motifs), any anti-Carb-fibrinogen or anti-Carb-FCS positivity, positivity for IgG anti-acetylated histone 2B, or high levels of IgG anti-MAA. The frequency (%) of positive patients for the assay, shown in columns (x-axis), are presented for the patient groups, shown in rows (y-axis).

