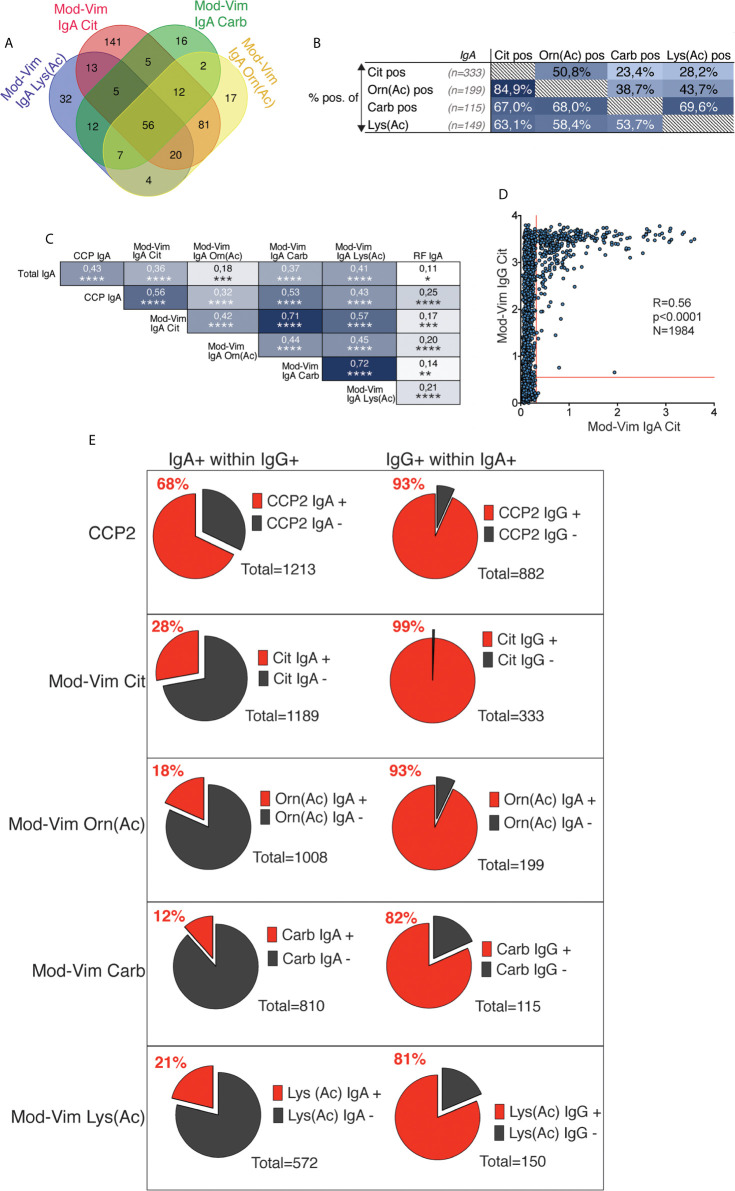
Figure 6.
Correlation between different IgA AMPA reactivities in RA. (A) Venn diagram for AMPA IgA positivity by mod-Vim assays among 1984 RA patients. (B) Distribution of mod-Vim IgA AMPA assay positivity among 1984 RA patients. The frequency (%) of positive patients for the assay, shown in columns (x-axis), are presented for the patient groups, shown in rows (y-axis). (C) Spearman correlation of IgG and IgA AMPA reactivity in 402 RA patients. (D) Spearman correlation of mod-Vim citrulline IgG compared to IgA reactivity in 1983 RA patients. (E) Frequencies of IgA+ within IgG+ patients (left panels) and frequencies of IgG+ within IgA+ patients (right panels) for the same assays.

