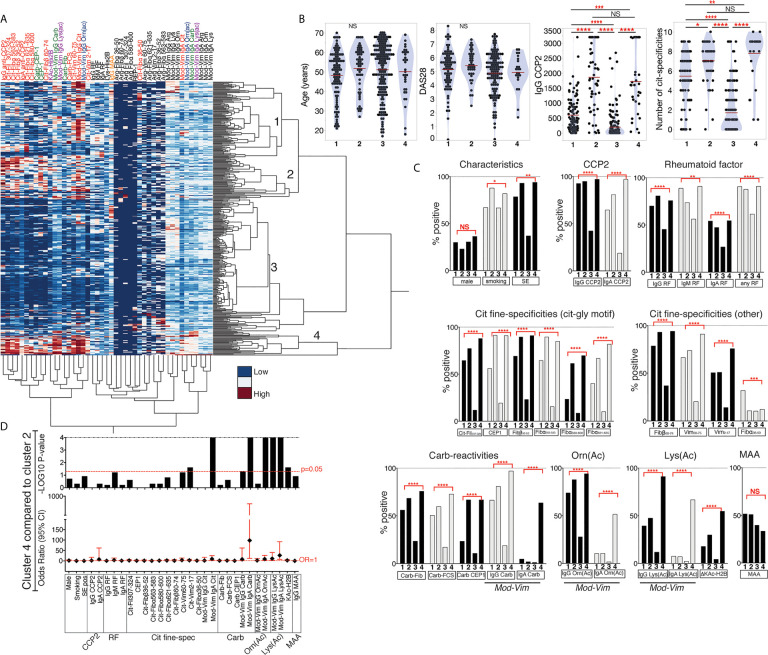
Figure 7.
Cluster analysis reveals different subsets of RA patients with AMPA reactivity. (A) Hierarchical clustering of autoantibody reactivities in 384 RA patients using Ward’s method and normalized values. Four clusters of patients were further analyzed, with cluster 3 (n = 187) being primarily ACPA negative/low, and cluster 1 (n = 107), cluster 2 (n = 57) and cluster 4 (n = 33) with higher autoantibody positivity. (B) Differences in age, DAS28 disease activity, IgG anti-CCP2 and number or ACPA fine-specificities (of 10 tested) in the different clusters. P-values are indicated from Kruskal-Wallis analysis with Dunn’s correction for multiple comparisons. (C) Comparison of frequency of antibody positivity in the different patient clusters. P-values are indicated from logistic regression analysis, showing if the three ACPA+ clusters (1, 2 and 4) are significantly different when adjusting for age, HLA shared epitope, sex, smoking, and DAS28. (D) Comparison of autoantibody positivity and characteristics between cluster 2 and 4 using Fisher’s exact test.

