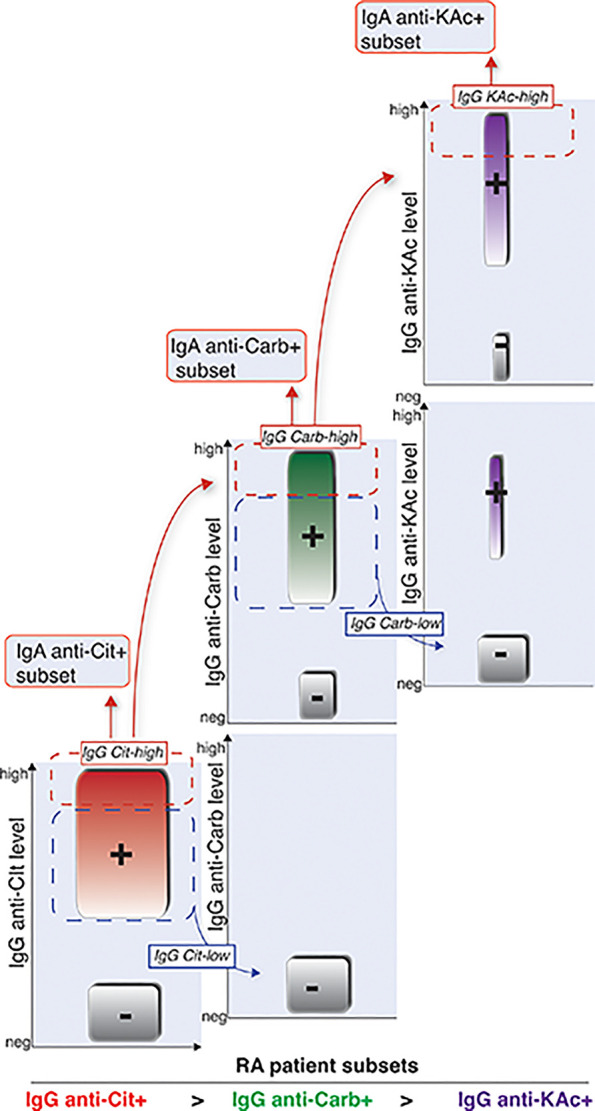
Figure 9.

Schematic illustration of how different RA AMPA+ patient subsets are related. Graphical visualization of how we interpret that the different AMPA subsets are related in RA patients. Cit-reactivity represents the largest subset followed by Carb-reactivity. KAc is observed in a smaller subset of RA patients. The IgG-Carb reactivity is more frequent in RA patients with high detectable levels of Cit-reactivity, and KAc is more frequent in patients with Cit and Carb positivity. Similarly, IgA reactivity is observed in smaller subsets of RA patients with high IgG levels of the same AMPA reactivity.
