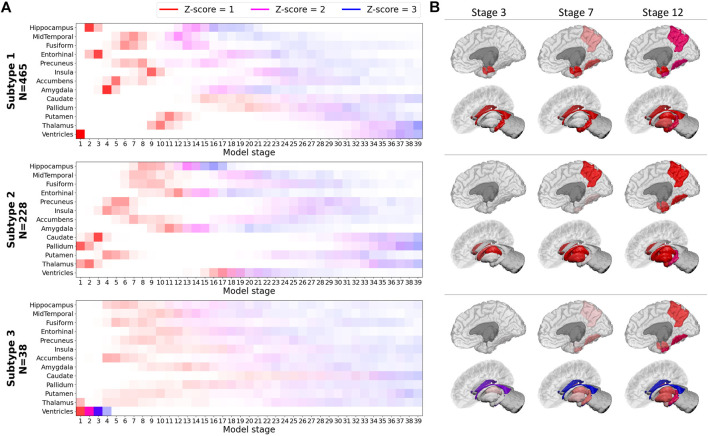
FIGURE 1.
SuStaIn model built on the basis of volumetric biomarkers of the training set.(A) Z-score progression patterns for each subtype. Color shades indicate the probability of a Z-score to increment, “N” indicates the number of subjects from the training set assigned to each subtype (B) Representations of early stages for each subtype.

