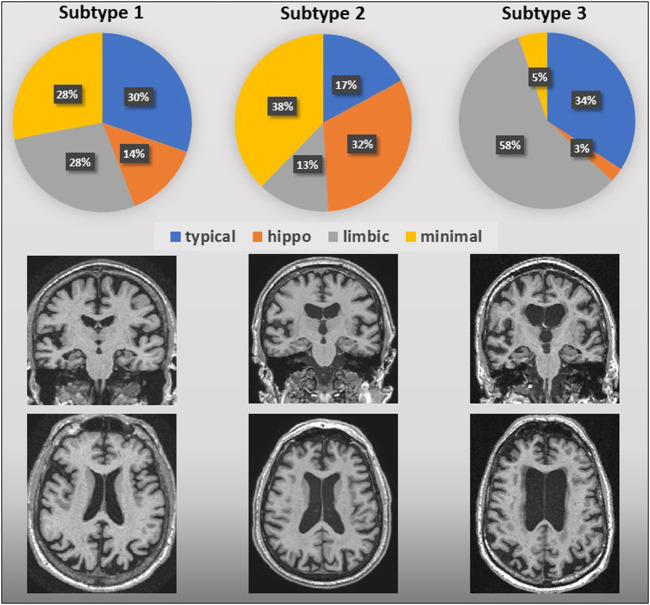
FIGURE 2.
AVRA vs. SuStaIn subtypes of AD. Pie graphs represent the percentage of AVRA subtypes subjects for each SuStaIn subtype. Regional atrophy in AVRA was measured with the MTA, PA and GCA-F scales based on T1-3D weighted images; below, visual examples of the SuStaIn atrophy subtypes are shown.

