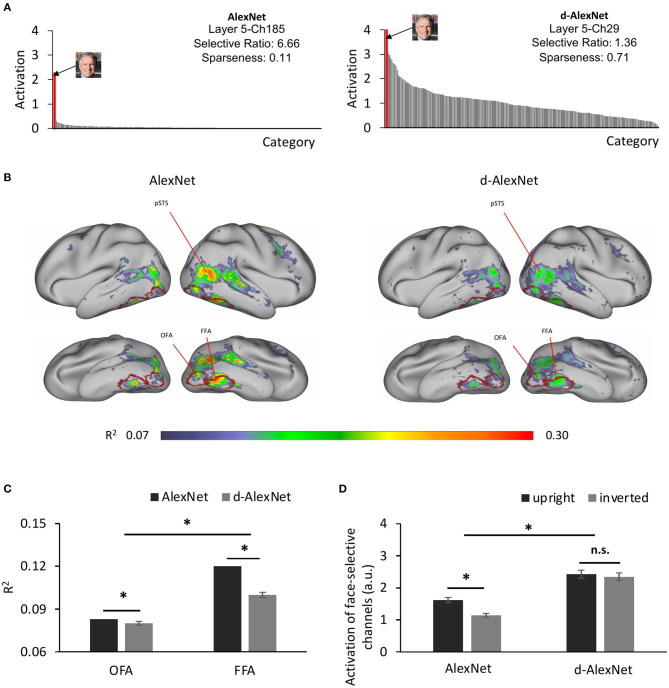
Figure 2.
(A) The category-wise activation profiles of example face-selective channels of the AlexNet (left) and the d-AlexNet (right). The “faces” shown here were AI-generated for illustration purpose only. (B) The R2 maps of the regression with the activation of the d-AlexNet's (right) or the AlexNet's face-selective channels (left) as the independent variables. The higher R2 in multiple regression, the better correspondence between the face channels in the DCNNs and the face-selective regions in the human brain. The crimson lines delineate the ROIs of the OFA and the FFA. (C) The face-channels of both DCNNs corresponded better with the FFA than the OFA, and the difference between the AlexNet and the d-AlexNet was larger in the FFA. (D) Face inversion effect. The average activation amplitude of the top two face-selective channels differed in response to upright and inverted faces in the AlexNet but not the d-AlexNet. The error bar denotes standard error. The asterisk denotes statistical significance (α = 0.05). n.s. denotes no significance.

