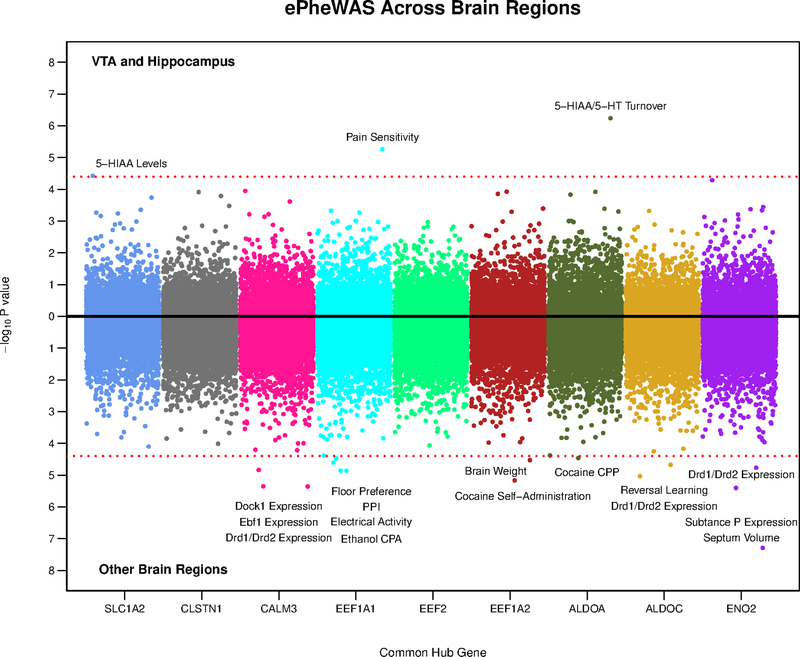
Figure 6:
Miami plot showing the results of our ePheWASs of common hub genes from the turquoise and blue gene networks. Each dot is a nervous system phenotype/trait (1,250 unique traits), which are color coded by hub gene (x-axis). The y-axis represents the –log10 p-value from the association of a hub gene’s expression with a particular trait in a certain brain region. The top part of the plot shows results from the VTA or hippocampus and the bottom includes results from eight other cortical/sub-cortical brain regions. The dashed red line denotes the Bonferonni correction for multiple testing (0.05/1,250) and thus, all dots surpassing this threshold indicate significant associations between the expression of a gene with a trait. Note that our ePheWAS analyses utilized BXD mice, which are derived by crossing C57BL/6J and DBA/2J inbred mice. PPI = pre-pulse inhibition; CPP = conditioned place preference; CPA = conditioned place/taste aversion.

