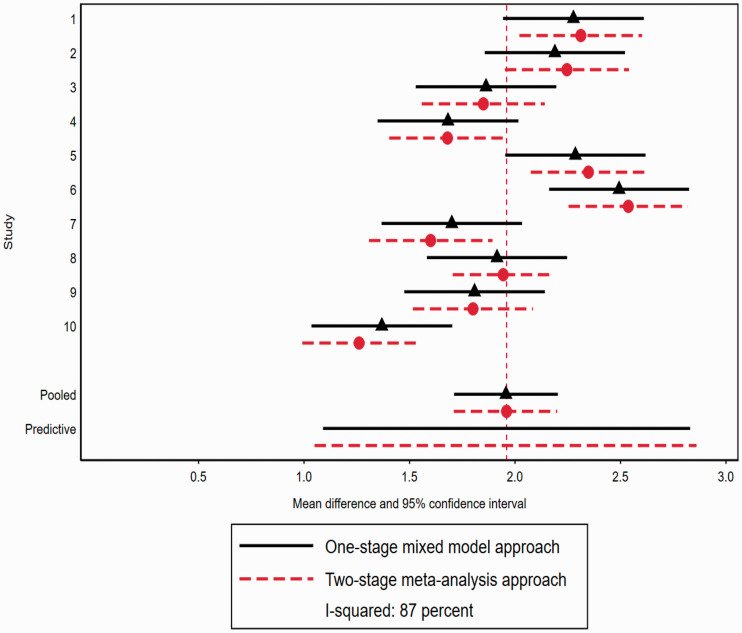
Figure 2.
Treatment effect heterogeneity in individual patient data meta-analysis: illustrative example of treatment effect heterogeneity across simulated studies comparing a two-stage random effects meta-analysis with a one-stage mixed model approach (example 1). Red dash lines with circle points represent mean difference and 95% CIs estimated using the two-stage meta-analysis approach and the black line and diamond represent the mean difference and 95% CIs estimated using the one-stage mixed model approach (see text for details). Also presented are predictive intervals for a study not included in meta-analysis.

