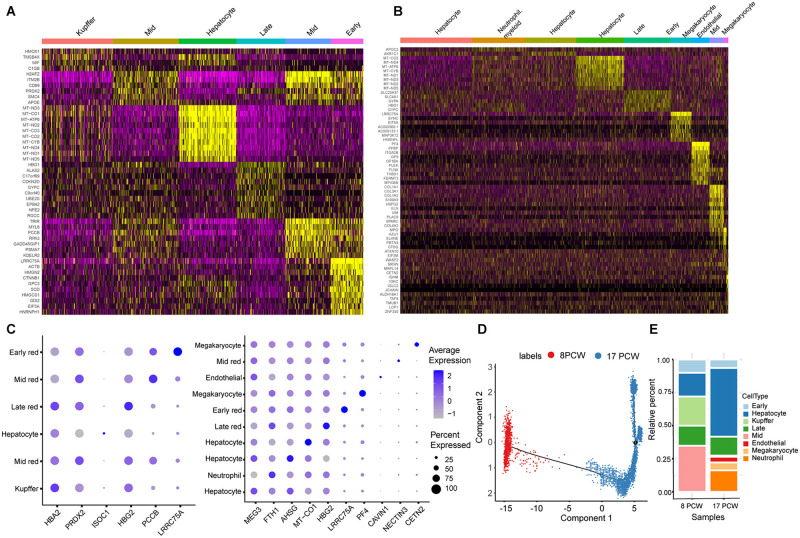
FIGURE 3.
The specificity of marker gene expression. (A,B) Heatmap of standardized expression for the top 10 marker genes identified for each cell type in the 8 PCW (A) and 17 PCW liver (B). Each row represents a signature gene, and each column represents a cell. Yellow indicates high expression of a particular gene, and purple indicates low expression. (C) The dot plot shows the relative expression of signature genes in each cell type of the 8 PCW (Left) and 17 PCW liver (Right). Gene-expression frequency (percentage of cells within each cell type expressing the gene) is indicated by spot size, and expression level is indicated by color intensity. (D) Pseudotime analysis shows the differentiation and relation of all spots in 8 PCW and 17 PCW live tissue. (E) Plot showing the proportional contribution of cell types identified in panel (E) to the fetal liver tissue over developmental time. PCW, post-conception weeks.

