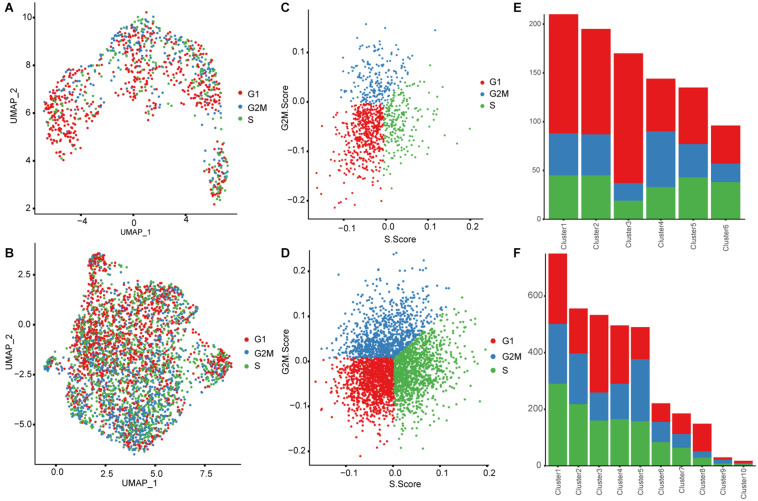
FIGURE 8.
Cell cycling stage analysis of the fetal liver cells. (A–D) UMAP plots and Cell Cycle Scoring Plot showing the cell cycle phases of in 8 PCW (A,C) and 17 PCW liver cells (B,D). (E,F) Plot showing the proportional contribution of cells in different phases (G1, G2/M, and S) identified in each cell cluster from 8 PCW (E) and 17 PCW liver (F).

