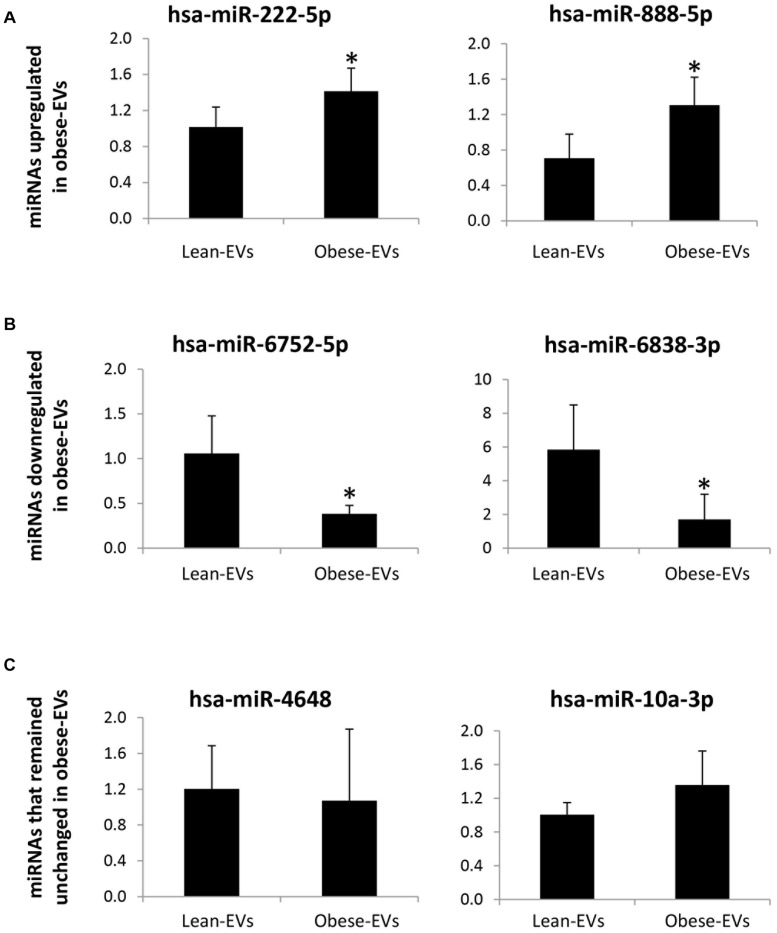
FIGURE 4.
miRNA sequencing validation. In samples treated with RNAse expression of candidate miRNAs by qPCR followed the same patterns as the original miRNA sequencing findings (without RNAse treatment). hsa-miR-222-5p and has-miR-888-5p, which were upregulated in obese-EVs vs. lean-EVs by miRNA sequencing analysis were also upregulated in obese-EVs vs. lean-EVs treated with RNAse (A). hsa-miR-6752-5p and has-miR-6338-3p, which were downregulated in obese-EVs vs. lean-EVs by miRNA sequencing analysis were also downregulated in obese-EVs vs. lean-EVs treated with RNAse (B). hsa-miR-4648 and has-miR-10a3p, which did not differ between obese-EVs and lean-EVs by miRNA sequencing analysis remained similar in obese-EVs and lean-EVs treated with RNAse (C) (all Student’s t-test). *p < 0.05 vs. Lean-EVs.

