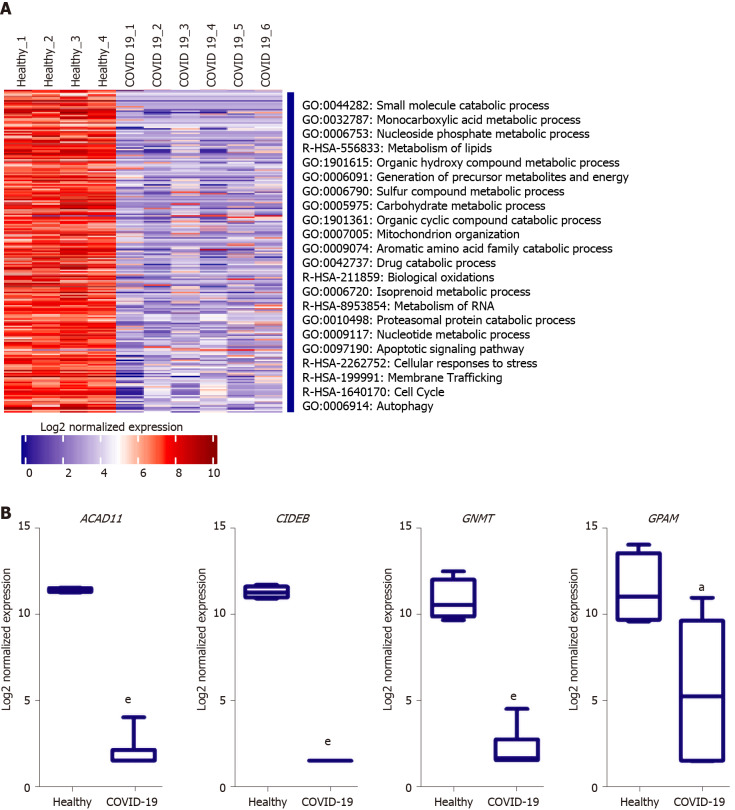
Figure 6.
functional clustering analysis of the downregulated transcriptome of severe coronavirus disease 2019 patients liver autopsy tissues. A: Heatmap representation of the differentially downregulated genes and subsequently enriched pathways and functional clusters in severe acute respiratory syndrome coronavirus 2 (SARS-CoV2) infected liver samples in comparison to baseline expression in healthy tissue samples; B: box plot representation of some of the top downregulated transcripts in SARS-CoV-2 infected liver tissue samples. Data presented as mean ± SE; aP < 0.05, bP < 0.01, cP < 0.001, dP < 0.0005, eP < 0.0001 COVID-19 vs Healthy. ACAD11: acyl-CoA dehydrogenases 11; CIDEB: cell death-inducing DNA fragmentation factor alpha-like effector B; GNMT: glycine N-methyltransferase; GPAM: glycerol-3-phosphate acyltransferase and metabolism.

