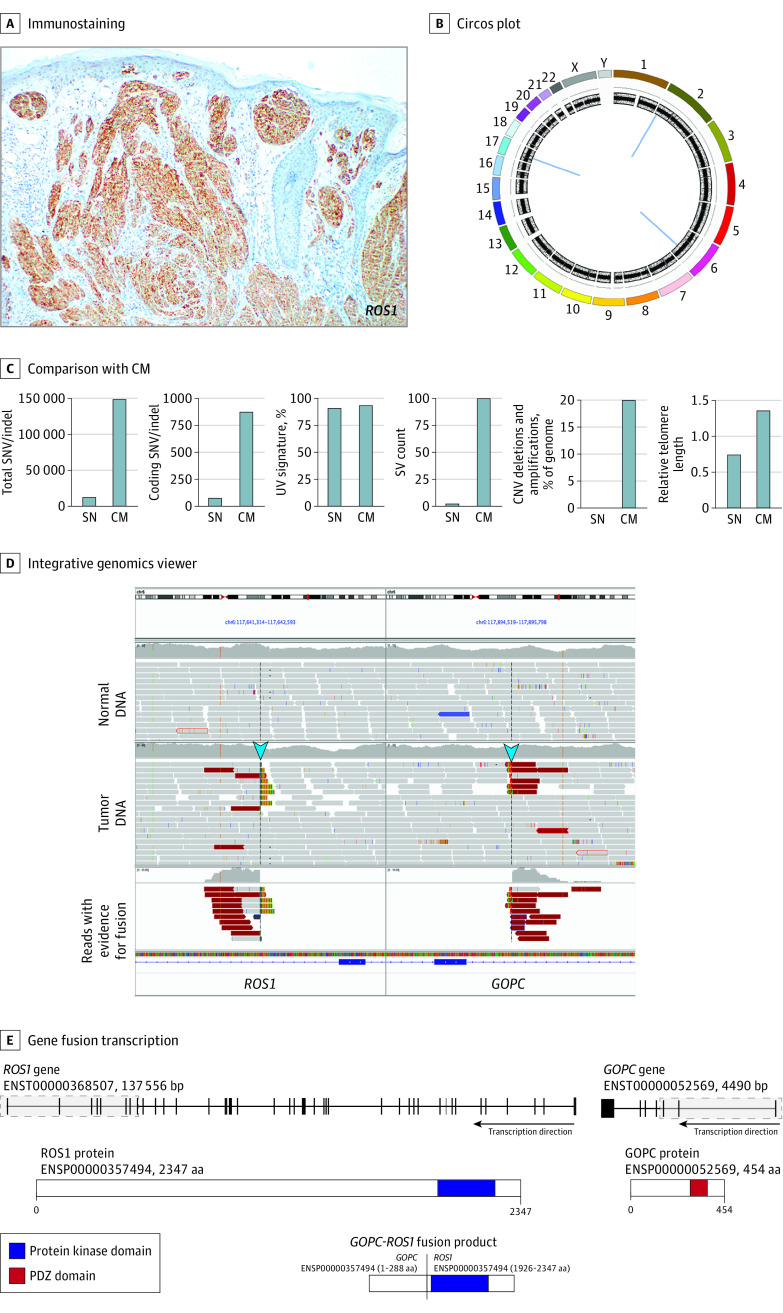
Figure 2. Immunophenotypic and Genetic Characterization of a Resected Agminated Spitz Nevus.
A, Immunostaining for ROS1 expression. B, Circos plot showing copy number and structural variants. Chromosomes are colored in the outer ring; copy number and B allele frequency changes are shown in the inner rings. Structural rearrangements are shown in the middle (blue lines) and include events on chromosomes 1, 6, and 17. C, Comparison of genomic features of the case (SN) compared with related published mean values in cutaneous melanomas (CM).6 CNV indicates copy number variant; indel, insertion/deletion; SNV, single-nucleotide variant; SV, structural variant. D, Integrative genomics viewer image shows sequence reads with evidence of the structural rearrangement on chromosome 6 that fused the ROS1 and GOPC genes. Blue arrows show reads that indicated the fusion. E, The gene fusion event and predicted protein product of the ROS1-GOPC gene fusion. The gray shaded parts of each transcript indicate the regions of each gene that were fused. The protein products of ROS1 and GOPC and the GOPC-ROS1 fusion product are shown. aa indicates amino acids; bp, base pairs.

