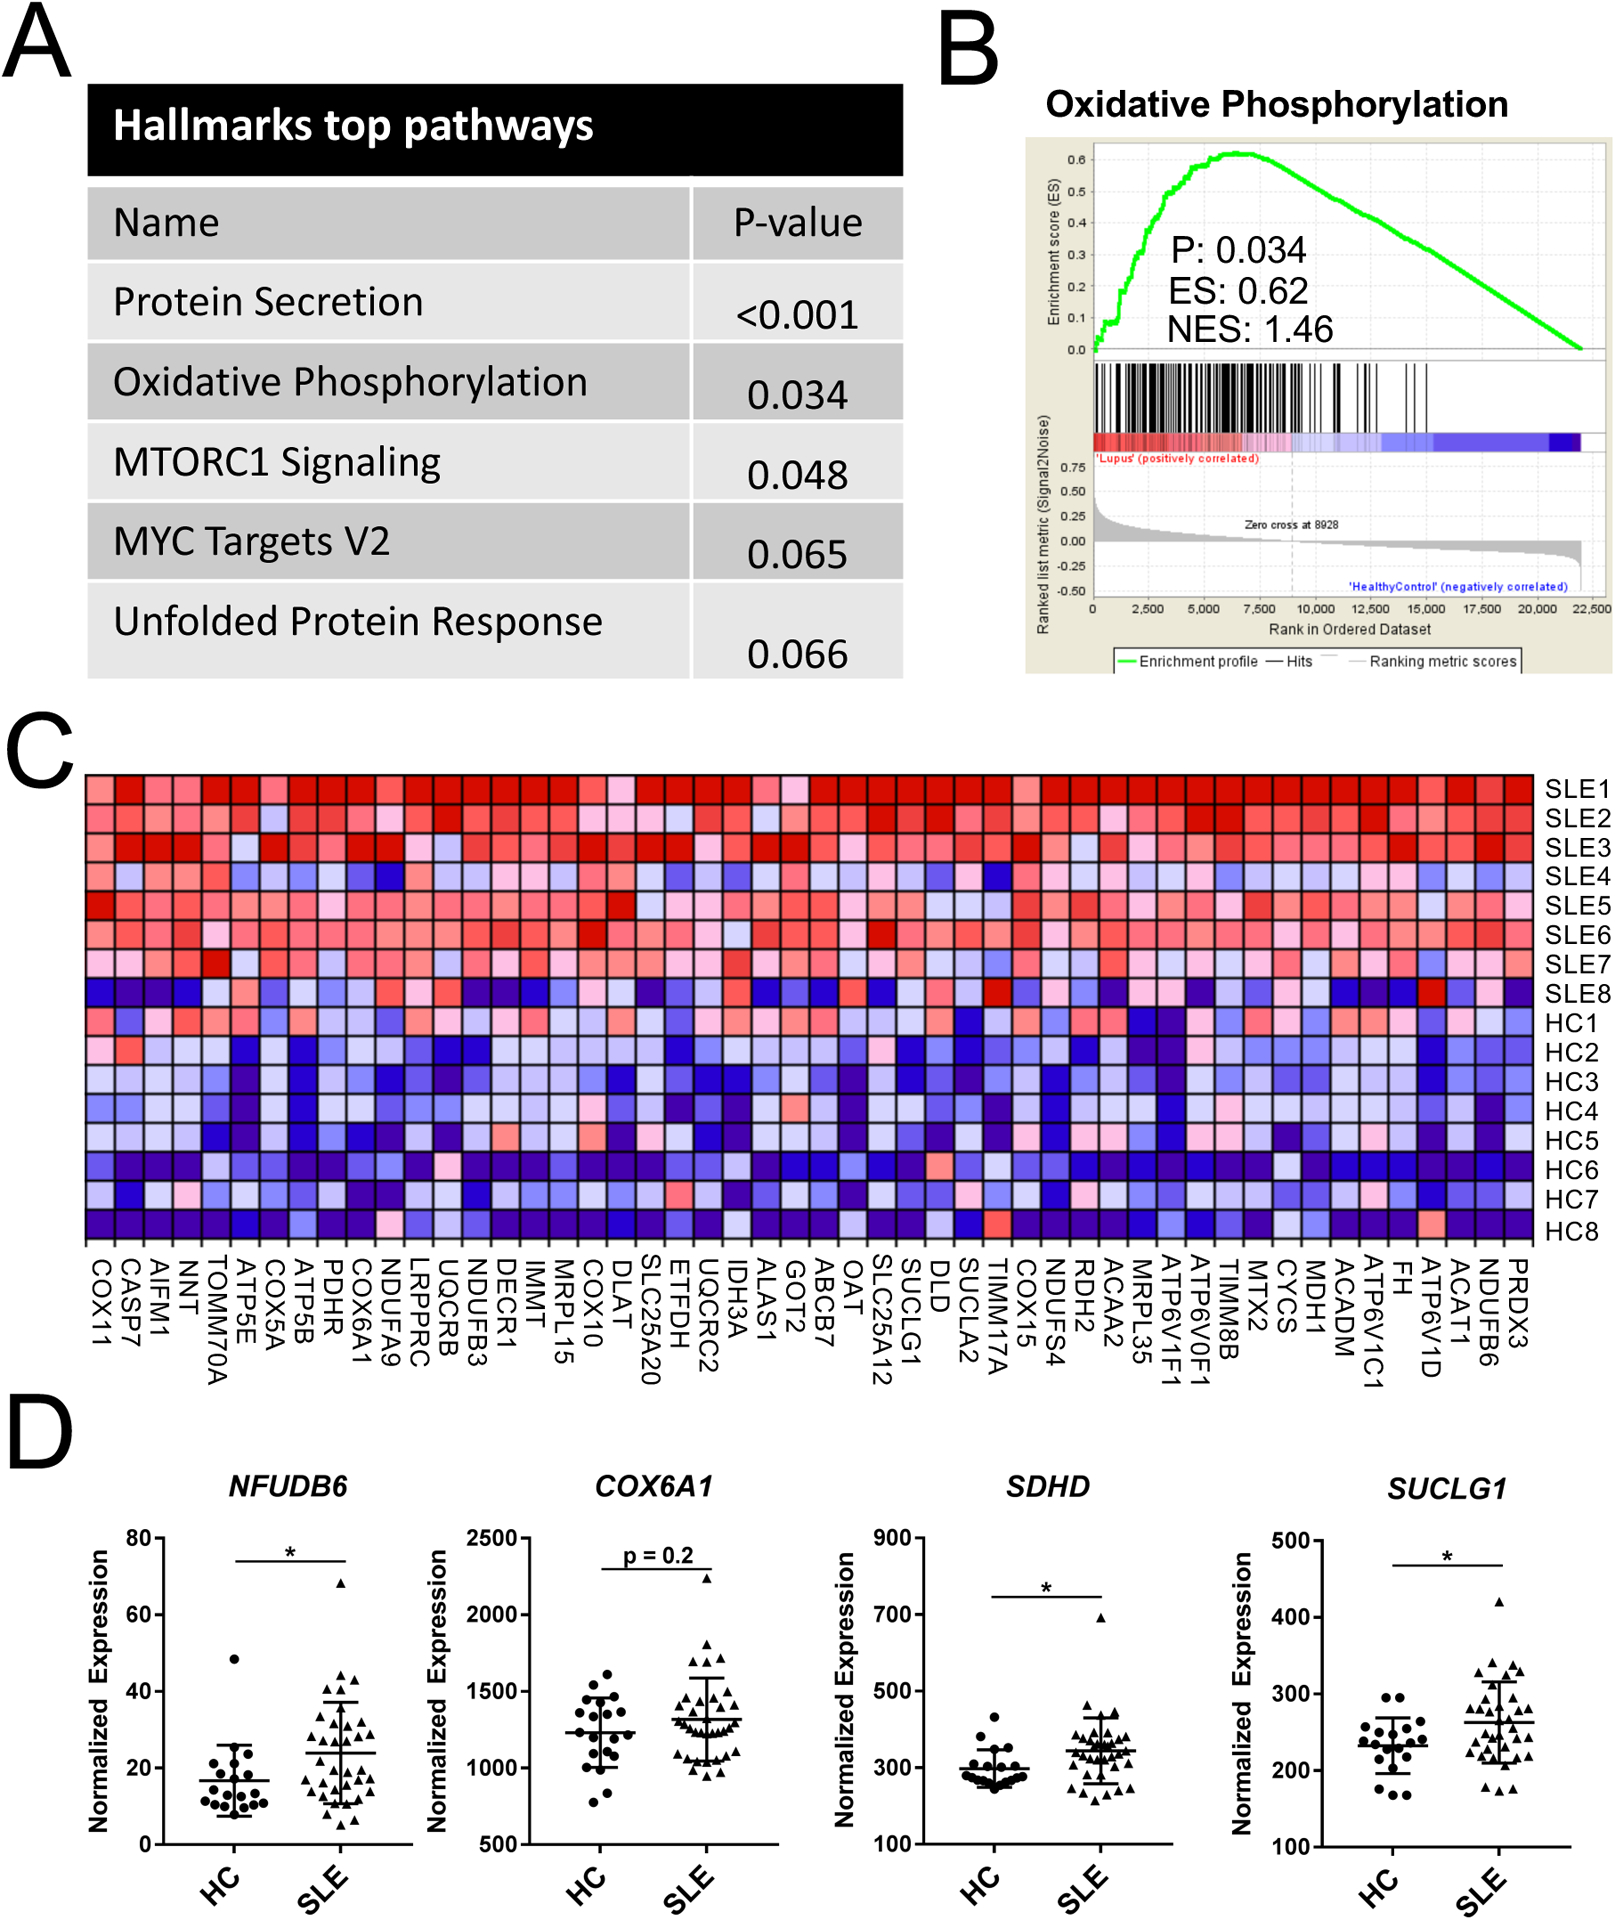
Fig. 1.

SLE CD4+ T cells have increased oxidative metabolism gene signature when compared with HC. A. Top five HALLMARKS pathway analysis differentially expressed between SLE and HC CD4+ T cells. B. Gene set enrichment plot for OXPHOS. C. Heatmap of microarray data for oxidative metabolism genes. Each row represents a SLE or HC subject. 131 of 193 total OXPHOS pathway genes comprised the core enrichment set. Genes are ranked right to left by enrichment score, and only the top 50 are shown due to space limitation. D. Nanostring nCounter validation of OXPHOS genes overexpressed in SLE CD4 T cells. N = 19 HC and 35 SLE, *p < 0.05. Student’s t-tests.
