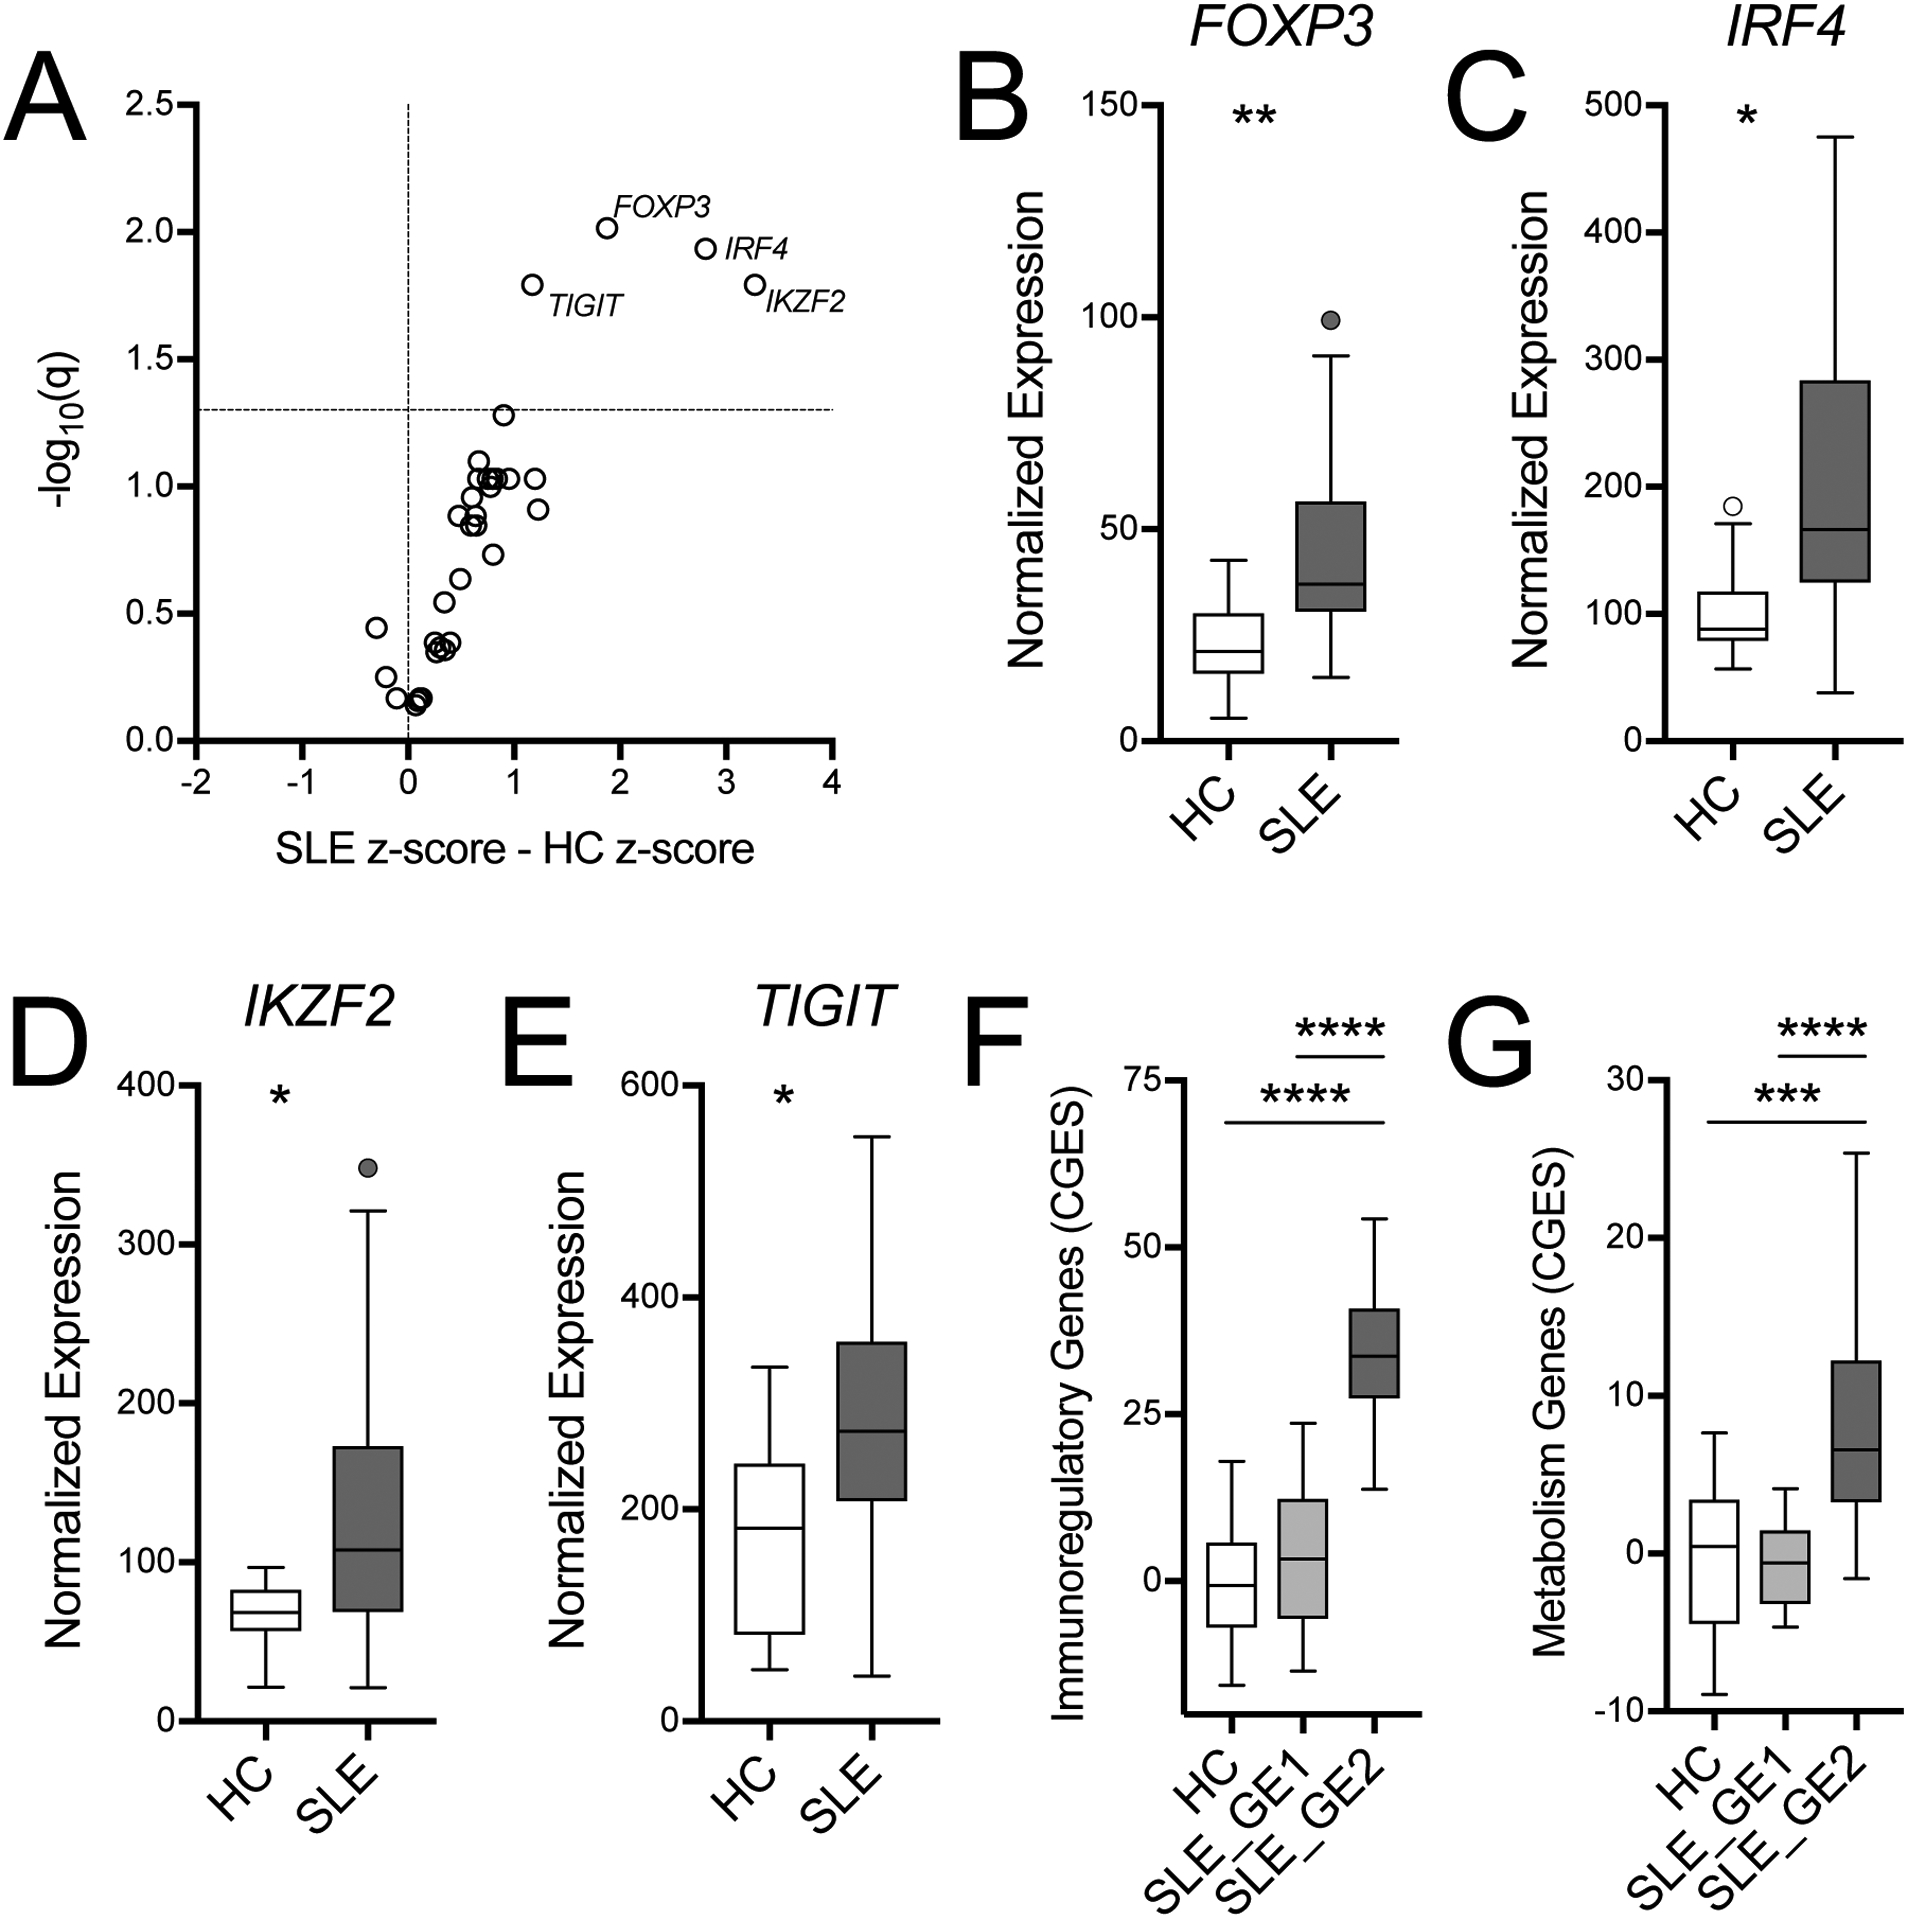
Fig. 2.

Immune gene expression is altered in SLE CD4+ T cells. A. Volcano plot of gene expression from a Nanostring code set of 35 genes indicates that 4 genes are significantly upregulated in SLE CD4 T cells. B. Normalized expression of individual genes: FOXP3, IRF4, IKZF2, and TIGIT. SLE cluster GE2 had a higher cumulative gene expression score (CGES) for immunoregulatory (C) and metabolic genes (D) than either SLE cluster GE1 or HC. Gene function is defined in Supplemental Table 1. CGES was computed as the sum of z-scored gene expression. Box plots are Tukey box and whiskers. Two-stage step-up method FDR t-test *q < 0.05, **q < 0.01. HC: n = 19, SLE: n = 35, GE1: n = 17; GE2: n = 18.
