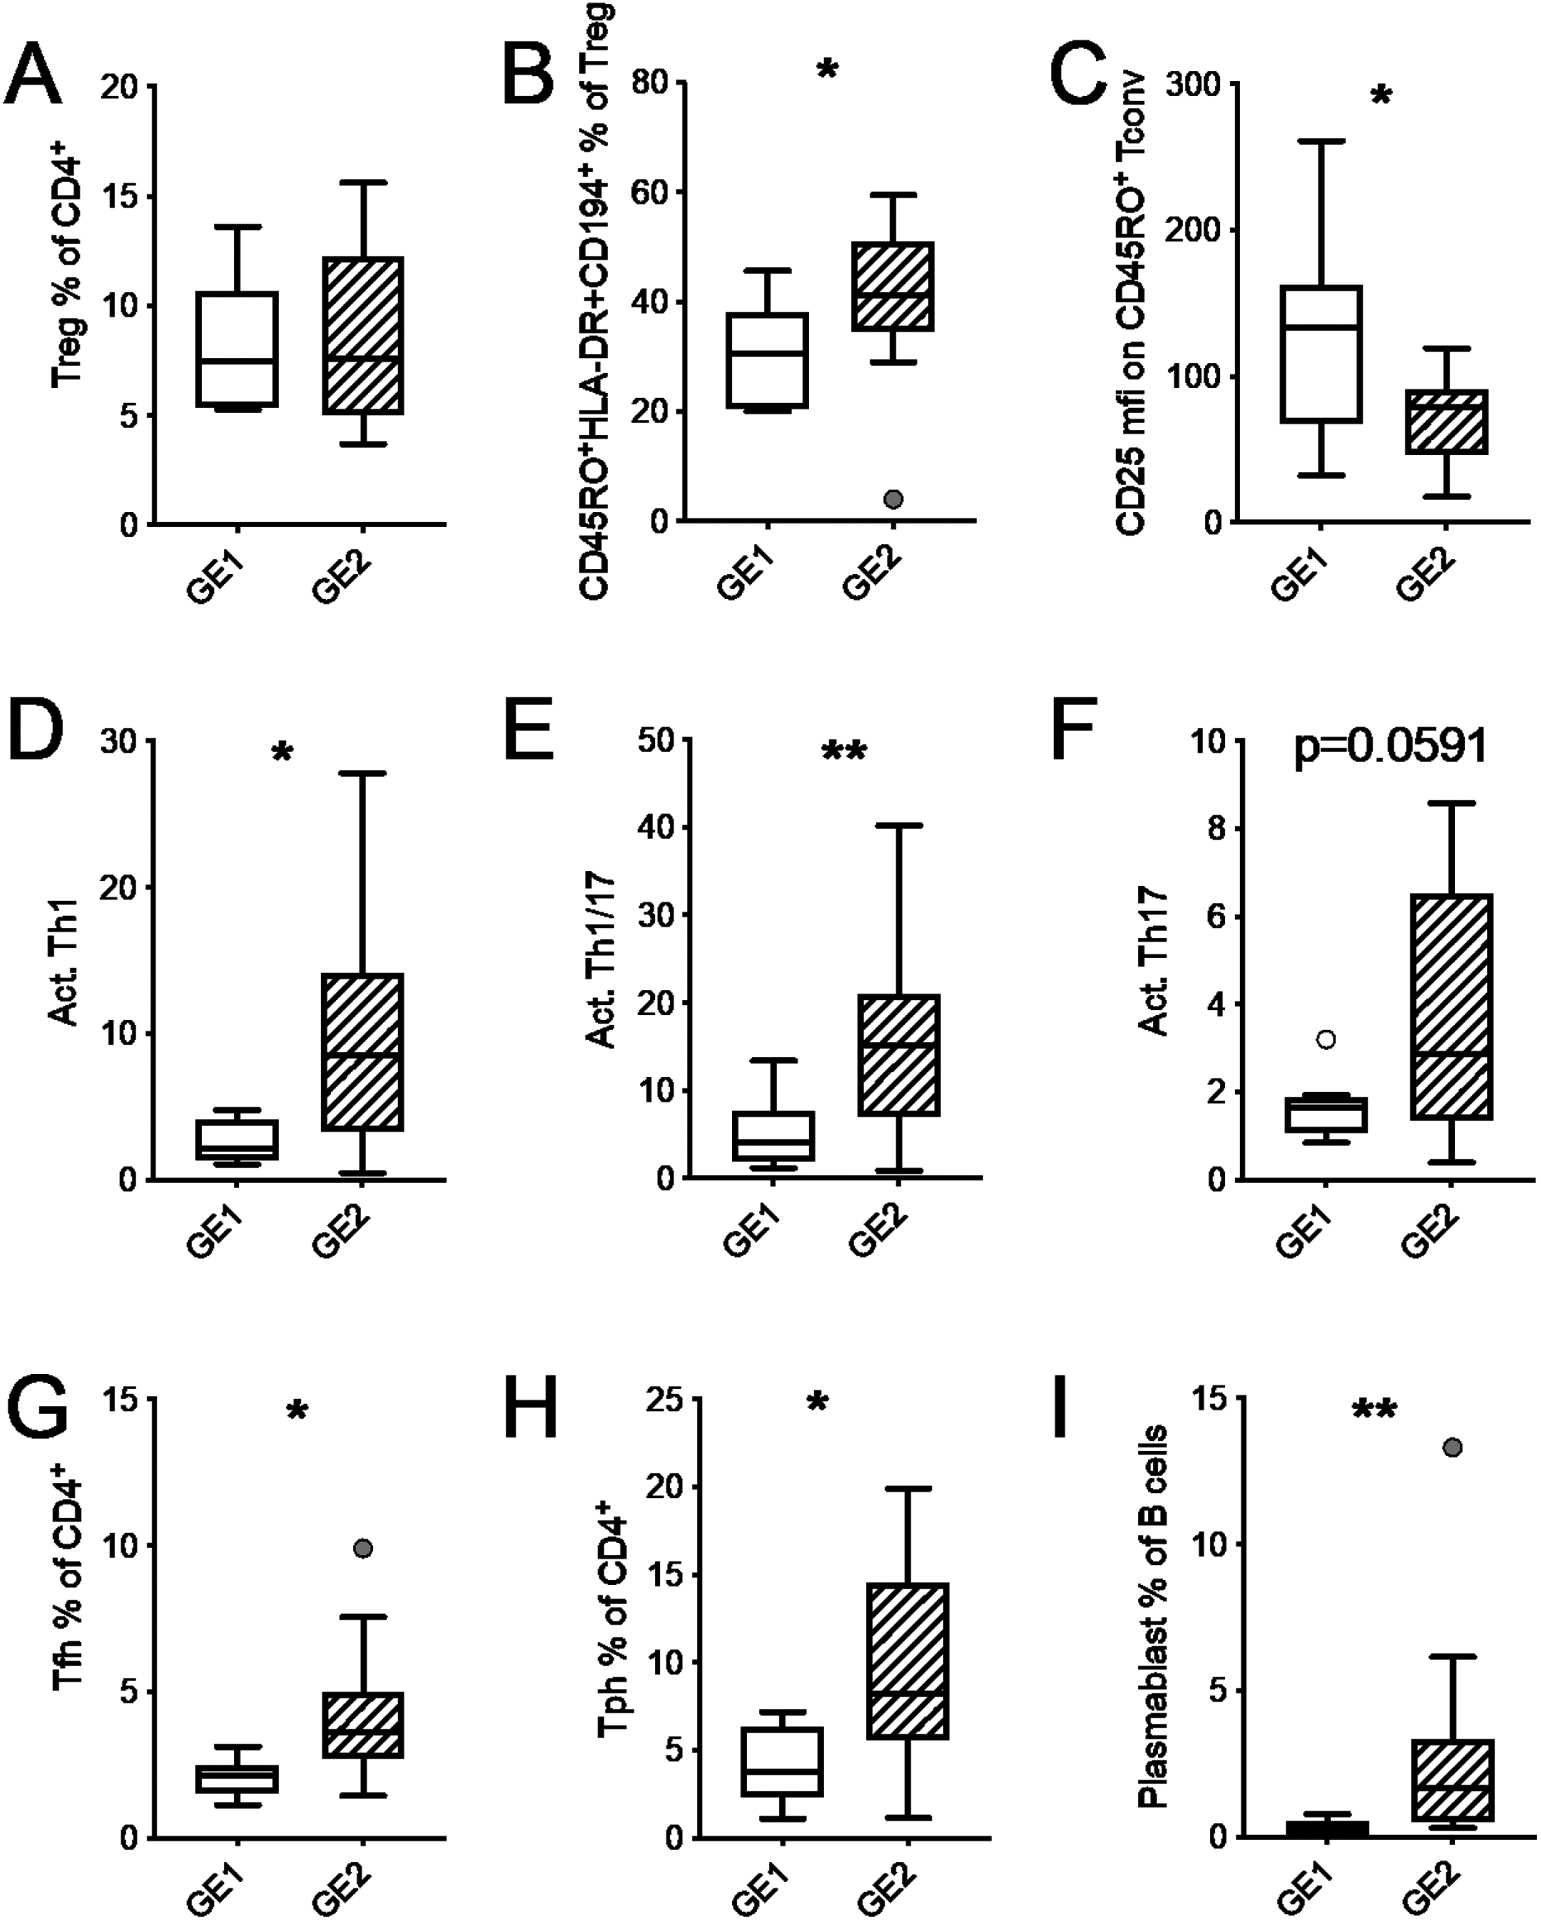
Fig. 4.

SLE patients from cluster GE2 present activated immunophenotypes. GE1 and GE2 transcriptional clusters were defined in Fig. 2. A. Frequency of Treg cells among CD4+ T cells. B. Frequency of effector cells among Treg cells. C. CD25 expression (mfi) on activated Tconv cells. Frequency of Th1 (D), Th1/Th17 (E), and Th17 (F) among activated CD4+ T cells. Frequency of Tfh (G) and Tph (H) cells among CD4+ T cells. (I) Frequency of plasmablasts among B cells. Box plots are Tukey box and whiskers. Two-stage step-up method FDR T-test * q <0.05, ** q < 0.01.
