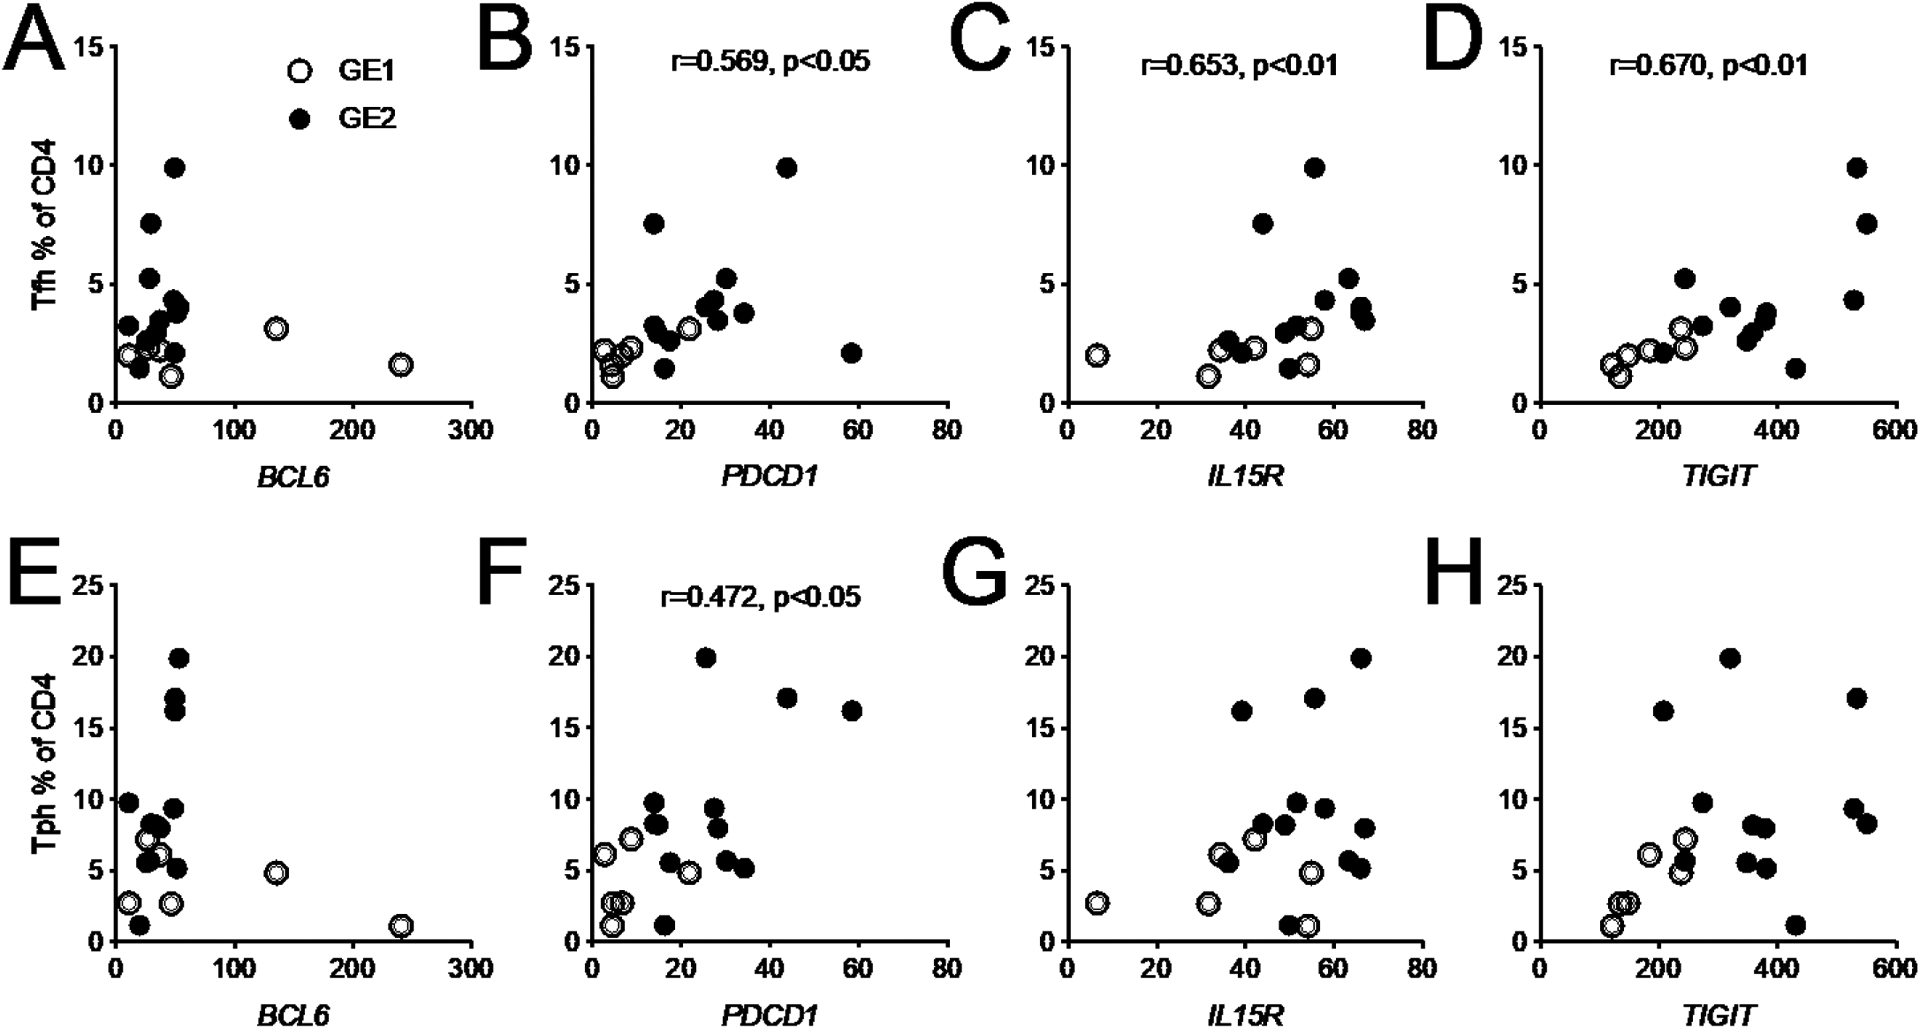
Fig. 5.

Correlations between the frequency of Tfh (top) or Tph (bottom) cells and the expression in total CD4+ T cells from SLE patients for BCL6, PDCD1, IL15R and TIGIT. GE1 and GE patients are represented by open and closed symbols, respectively. Spearman correlation r values and corresponding p values are shown.
