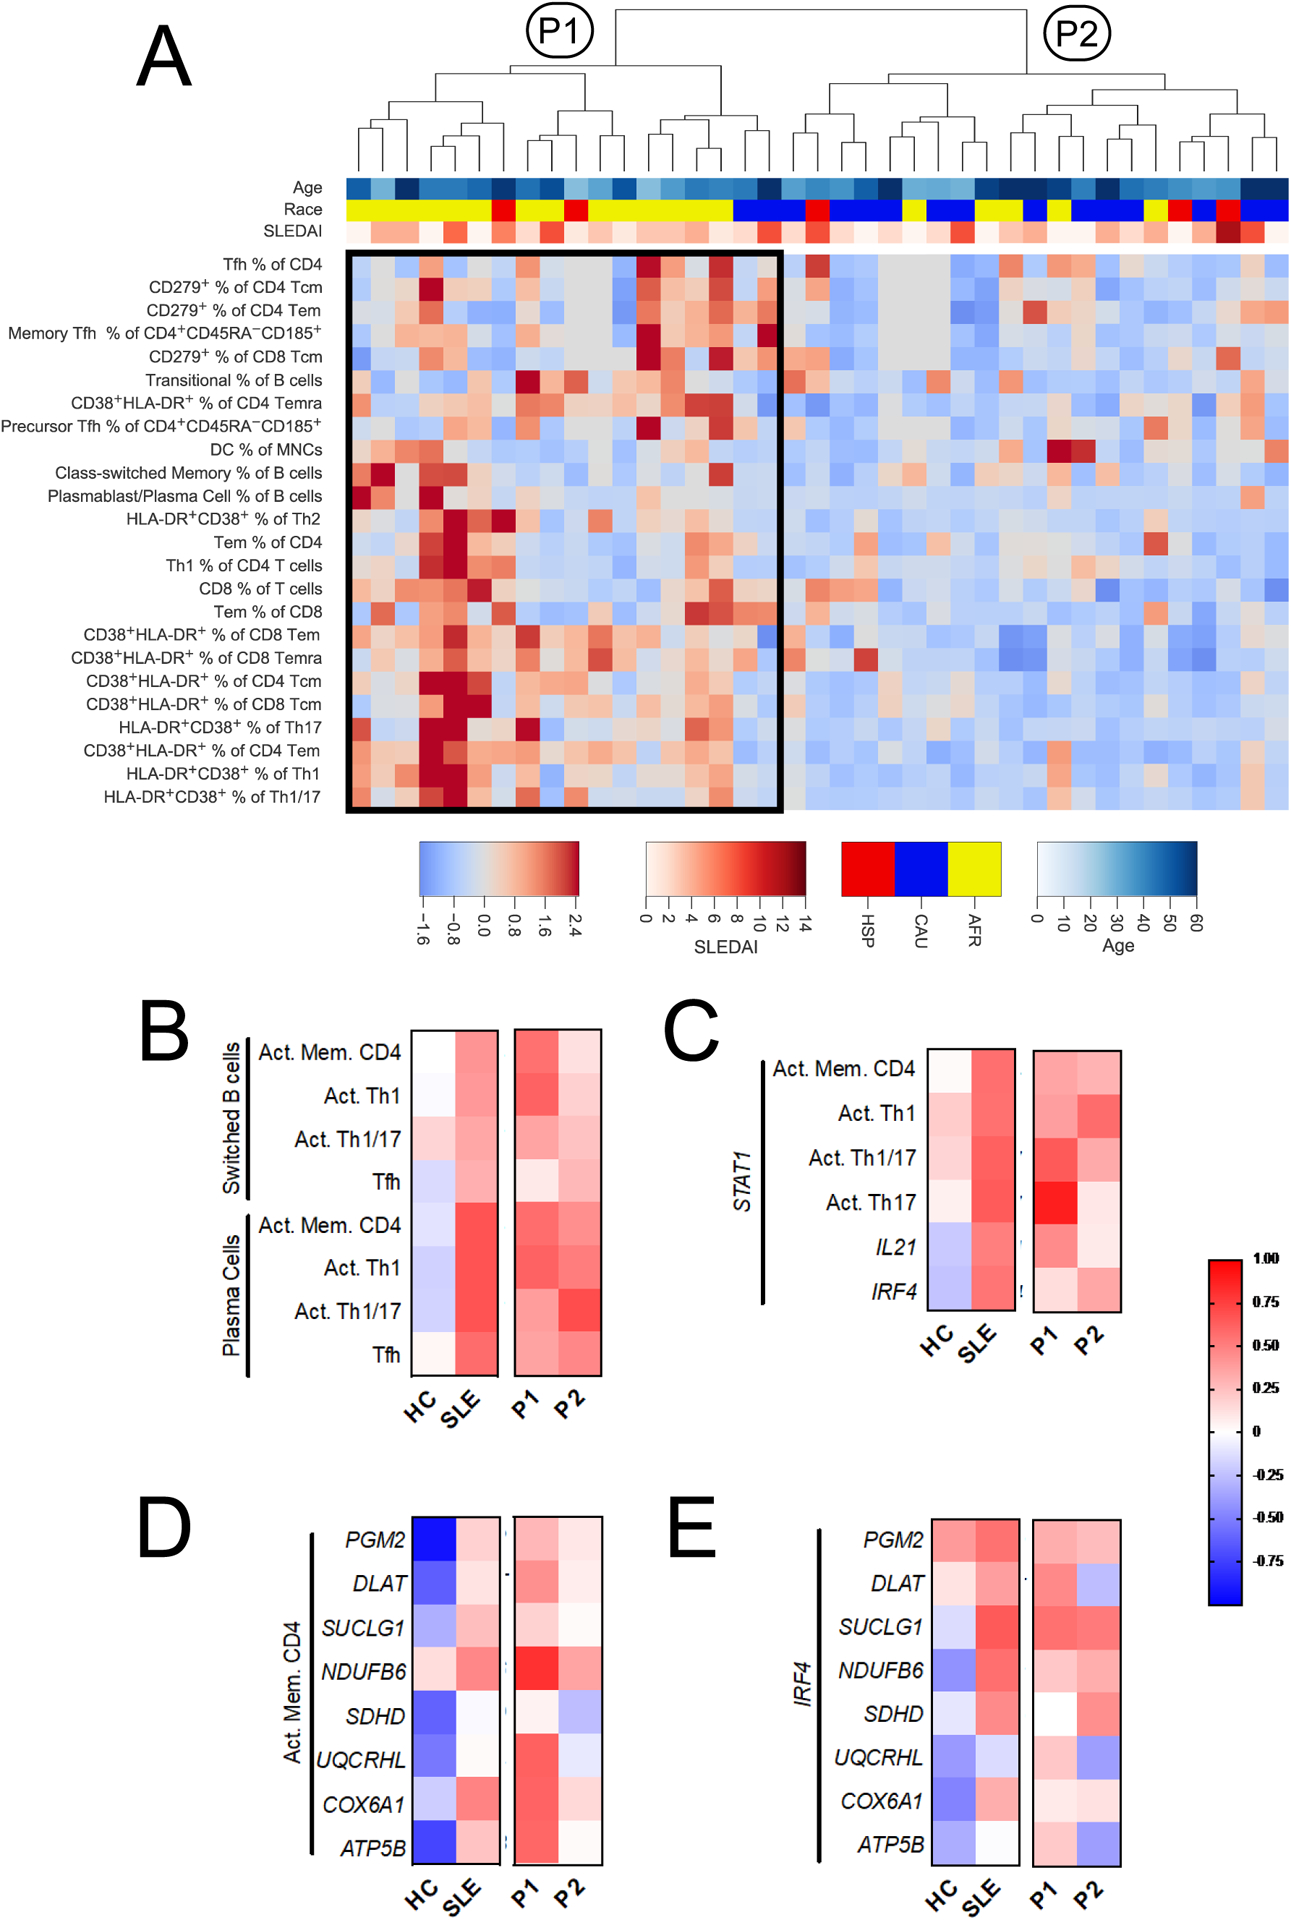
Fig. 6.

SLE CD4+ T cells present altered patterns of immunophenotype and gene expression correlation. A. Hierarchical clustering of SLE patients by immunophenotypes reveals two major groups, P1 and P2. Cluster P1 featured increased frequencies of the 24 immunophenotypes shown on the heatmap. The color bar legend indicates age (top), ethnicity (middle), and SLEDAI (bottom). Due to space limitations, the phenotype dendrogram is not shown and heatmap excludes all phenotypes that were not in the top phenotype cluster. B – E. Correlations between immunophenotypes and gene expression are shown for HC and SLE, as well as for the SLE immunophenotypes subsets, P1 and P2, defined by hierarchical clustering. B. Correlation between class-switched B cells and plasma cells with CD4+ T cell subsets. C. Correlation between STAT1 gene expression in CD4+ T cells and T cell immunophenotypes, or other genes from the Nanostring code set. D. Correlations between activated memory CD4+ T cells and metabolic gene expression. E. Correlation between the expression of IRF4 and that of metabolic genes. Correlations were evaluated by Spearman r. Activated memory CD4+ T cells (Act. Mem. CD4+, B, C, and D) is the proportion of CD38+HLA-DR+ cells within non-naïve cells (Tcm, Tem, and Temra). For immunophenotype comparisons (B), HC n = 23, SLE n = 39, P1 n = 18, and P2 n = 21. For gene expression and immunophenotype comparisons (C and D), HC n = 9, SLE n = 22, P1 n = 12, and P2 n = 10. For gene expression comparisons (E), HC n = 19 and SLE n = 35, P1 n = 12, and P2 n = 10.
