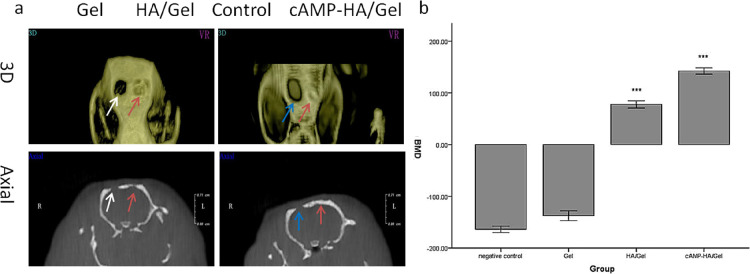
Figure 5.
(a) 3D and axial images of Gel, HA/Gel, and cAMP-HA/Gel scaffolds implanted into skull defects for 12 weeks. The blank group acted as a control. The white and blue arrows indicate Gel and control groups, respectively. The red arrow refers to the HA/Gel and cAMP-HA/Gel scaffolds. (b) BMD statistical analysis of the skull defects of the control, HA/Gel, BMSC-cAMP HA/Gel, and Gel scaffolds implanted into bone defects for 12 weeks, respectively (***P < 0.001 cAMP-HA/Gel group compared with the control, Gel, and HA/Gel; *** P < 0.001 HA/Gel compared with the control and Gel groups).

