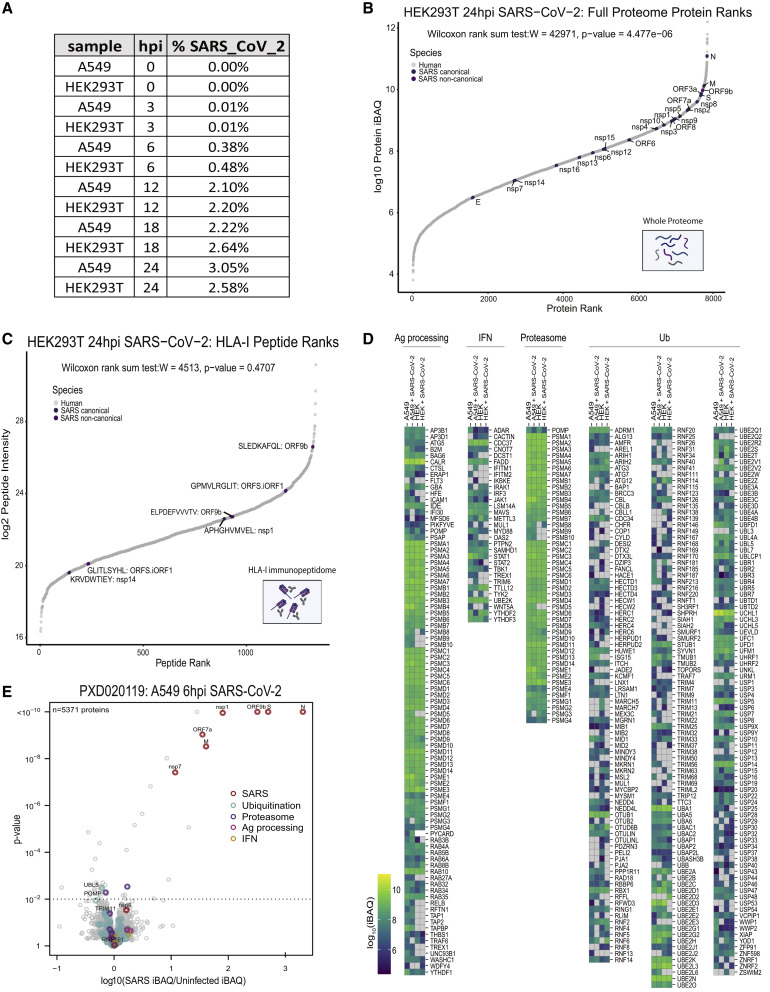
Figure S3.
SARS-CoV-2 peptide abundance and antigen presentation pathway proteins in infected cells, related to Figure 4
(A) Table showing the percentage of the total whole proteome abundance represented by SARS-CoV-2 derived proteins at 0, 3, 6, 12, 18, 24hpi identified in singleshot whole proteome LC-MS/MS analyses. (B) Rank plot of the protein abundances represented by log10 protein iBAQ values for each human (gray), canonical SARS-CoV-2 (blue), and noncanonical SARS-CoV-2 proteins detected in the whole proteome analysis of HEK293T cells 24hpi. SARS-CoV2 proteins are annotated with their respective gene names. (C) Similar rank plot to (A) but for observed HLA-I peptides and their abundances represented by log2 peptide intensities in HEK293T cells 24hpi. Peptides mapping to SARS-CoV-2 are annotated with their respective amino acid sequence and source protein name. (D) Heatmap of log10 iBAQ values for antigen presentation pathway proteins observed across uninfected and 24hpi in A549 and HEK293T cells. (E) Volcano plot comparing protein levels across uninfected and infected A549/ACE2 cells 6hpi reported in publically available whole proteome data (PXD020019). Proteins from SARS-CoV-2 (red), ubiquitination pathways (teal), proteasomal function (purple), antigen processing (pink), and IFN pathways (orange) are colored accordingly. Significantly changing proteins are shown above the dashed line (p value < 0.01) along with annotations of specific proteins involved in the above pathways.

