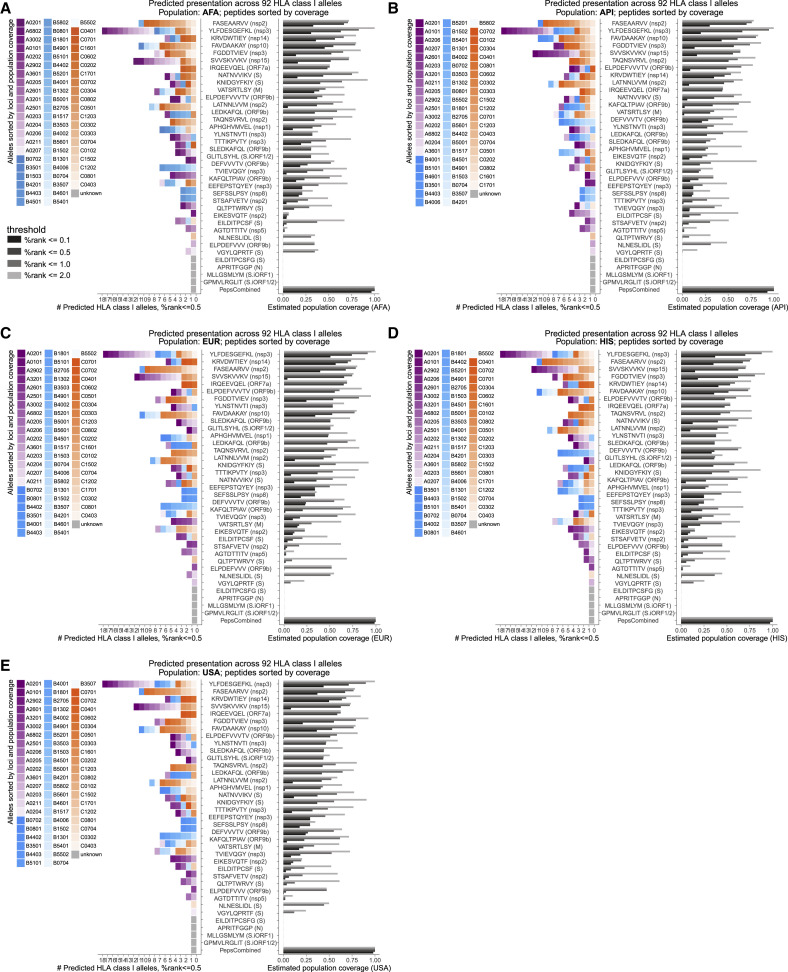
Figure S5.
Population coverage estimates of LC-MS/MS-identified SARS-CoV-2 HLA-I peptides, related to Figure 7
HLAthena predictions for 92 HLA-I alleles using percentile rank cutoff values of 0.1, 0.5, 1, and 2% were used to show the number of alleles and estimated coverage for each LC-MS/MS-observed SARS-CoV-2 peptides across (A) AFA, (B) API, (C) EUR, (D) HIS, and (E) USA populations. Alleles are colored and ordered according to loci and the corresponding population frequency (high to low color intensity). Peptides are ordered according to their estimated coverage at %rank cutoff of 0.5.

