

Abstract

Oxidized starch can be efficiently prepared using H2O2 as an oxidant and iron(III) tetrasulfophthalocyanine (FePcS) as a catalyst, with properties in the same range as those for commercial oxidized starches prepared using NaOCl. Herein, we performed an in-depth study on the oxidation of potato starch focusing on the mode of operation of this green catalytic system and its fate as the reaction progresses. At optimum batch reaction conditions (H2O2/FePcS molar ratio of 6000, 50 °C, and pH 10), a high product yield (91 wt %) was obtained with substantial degrees of substitution (DSCOOH of 1.4 and DSCO of 4.1 per 100 AGU) and significantly reduced viscosity (197 mPa·s) by dosing H2O2. Model compound studies showed limited activity of the catalyst for C6 oxidation, indicating that carboxylic acid incorporation likely results from C–C bond cleavage events. The influence of the process conditions on the stability of the FePcS catalyst was studied using UV–vis and Raman spectroscopic techniques, revealing that both increased H2O2 concentration and temperature promote the irreversible degradation of the FePcS catalyst at high pH. The rate and extent of FePcS degradation were found to strongly depend on the initial H2O2 concentration where also the rapid decomposition of H2O2 by FePcS occurs. These results explain why the slow addition of H2O2 in combination with low FePcS catalyst concentration is beneficial for the efficient application in starch oxidation.
1. Introduction
Starch and starch derivatives have many applications in the food and paper industry. Modification of native starches is performed to improve properties and functionality and covers a wide span of reactions including esterification, etherification, cross-linking, and oxidation.1−3 Oxidation, in particular, is an attractive strategy to improve the physicochemical properties of starch. For example, oxidation leads to products with reduced gelatinization temperatures, improved flowability, improved starch paste stability, better solubility, higher transparency, and improved mechanical properties.3−7 Therefore, oxidized starch has been widely used in various industrial applications such as adhesives, thickeners, binders, coating and surface sizing agents, among others.4−7 During the oxidation process, hydroxyl groups of the anhydroglucose units (AGUs) at the C2, C3, and C6 positions are typically converted to carbonyl and carboxyl groups.8−10 These newly formed groups on the polysaccharide backbone lead to steric hindrance and the introduction of negative charges, resulting in a lower tendency for retrogradation. Besides, the molecular weight of the product is reduced due to breakdown of the starch backbone during the oxidation process.
Sodium hypochlorite (NaOCl) is a commonly used oxidant, and although it is efficient and relatively inexpensive, its use leads to the formation of stoichiometric amounts of inorganic salts and toxic chlorinated byproducts. In recent years, a considerable research effort had been made to investigate the use of alternative oxidation methodology such as 2,2,6,6-tetramethyl-1-piperidinyloxy (TEMPO)11−13 and in situ-generated nitrogen oxides.14,15 Although such catalytic systems offer high selectivity for the C6 oxidation, they still lead to toxic waste generation. Therefore, there is an incentive for the development of environmentally benign catalytic systems able to utilize H2O2 as an oxidant. Several metal salts including copper, tungsten, and iron have been proposed to activate H2O2.16 However, high catalyst loadings are generally required to achieve efficient oxidation leading to significant metal impurities in the products.
Metal phthalocyanines are relatively inexpensive and readily accessible on an industrial scale and shown to be very active catalysts for the activation of hydrogen peroxide to oxidize a variety of substrates including starch.17,18 Hence, metal phthalocyanines are very attractive catalysts for both academic research and potential industrial applications. A water-soluble iron(III) tetrasulfophthalocyanine (FePcS) complex (Figure 1) was used by Sorokin et al. as a catalyst for the efficient oxidation of potato starch (Scheme 1).16 Products with the desired amounts of carbonyl and carboxyl groups, viz a degree of substitution (DS) of 1–20 per 100 AGU units, were obtained.16,19,20 An in situ-formed peroxo complex PcSFeIII-OO- was suggested to be the active catalyst for the formation of carbonyl and carboxylic acid groups (Figure S1 in the Supporting Information).19,21
Figure 1.

Proposed structure of the sodium salt of the iron(III) tetrasulfophthalocyanine (FePcS) complex.
Scheme 1. Schematic Representation of the Oxidation of Starch to Oxidized Starch Containing Carboxyl Groups.

More recently, Tolvanen et al. and Salmi et al. reported the kinetics of starch oxidation with H2O2 using a FePcS catalyst, mainly focusing on the formation of carboxyl and carbonyl groups.21−23 Meanwhile, Klein-Koerkamp et al. investigated this catalyst for the oxidation of other biopolymers such as cellulose derivatives, guar gum, and inulin.24 In most cases, alkaline conditions relatively favor the oxidation of starch over hydrolysis to lower-molecular-weight compounds. Whereas the efficiency of the FePcS–H2O2 catalytic system for starch oxidation is known, relatively limited information is provided in the literature regarding the fate of the FePcS catalyst used over the course of the reaction. Such information is an important aspect for efficient application as it will determine (i) the amount of catalyst required, (ii) the extent of product purification required to remove catalyst residue, and (iii) variations to the product properties due to changes in the catalyst activity over the batch time. Process parameters including substrates, catalyst and oxidant concentrations, reaction times, and temperatures are considered crucial in assessing the practical and large-scale application of the FePcS–H2O2 system for starch oxidation. The influence of reaction parameters on catalyst activity, selectivity, and stability is particularly relevant and interesting in the area of oxidative modification of starch and starch derivatives, where a balance is sought between, among others, temperature and reaction time as well as catalyst and H2O2 use to achieve product specification at as low as possible process operation costs.
The objective of this present work is to look more closely at the workings of the FePcS–H2O2 catalytic system to first enable the production of oxidized starch products with properties in the range as for the benchmark NaOCl oxidation in terms of yield, degree of carboxyl and carbonyl substitutions, and viscosity. By the oxidation of model substrates including d-glucose, α-methyl-d-glucopyranoside, d-sorbitol, and d-cellobiose, we aim to explain the observed efficiency trends and study the relative reactivity of the different chemical motifs and the factors that determine selectivity during the catalytic oxidation. This is followed by an in-depth study on the stability of the FePcS catalyst under actual reaction process conditions using UV–vis and Raman spectroscopic techniques to gain new insights into the rate and extent of catalyst degradation that allow for process optimization.
2. Results and Discussion
2.1. Starch Oxidation Using the FePcS–H2O2 System
The catalytic oxidation of native potato starch using the FePcS–H2O2 catalytic system was performed in a batch reactor in water at a fixed starch intake of 39 wt % (dry basis). The main objective of this part of the work was to screen various experimental parameters (i.e., catalyst concentration, H2O2/catalyst ratio, batch time, mode of H2O2 addition) to obtain oxidized starch products with properties in the range as for NaOCl-induced oxidation. These properties include a DSCOOH of 5 per 100 AGU, which is the maximum DSCOOH value for food applications, and a viscosity below 500 mPa·s. The pH (10.0) and temperature (50 °C) used were fixed (conditions based on previous studies using the FePcS–H2O2 system21−23), and the reactions were allowed to proceed until all of the H2O2 added was consumed. The viscosity of the starch products was determined by urea viscosity measurements and the DSCOOH and DSCO using titration methods. The yields of oxidized starch products were determined gravimetrically, and low yields are an indication of the formation of considerable amounts of low-molecular-weight, water-soluble products. An overview of the results for all experiments is presented in Table 1.
Table 1. Catalytic Oxidation of Native Potato Starch with FePcS and H2O2 at 50 °C and pH 10.0.
| entry | FePcS (μM) | H2O2 (M)a | time (min)b | urea viscosity (mPa·s) | % carboxyl content (DSCOOH) | % carbonyl content (DSCO) | yield (wt %)c |
|---|---|---|---|---|---|---|---|
| 1 | 331 | 0.3 | 150 | 7073 | 0.7 | 0.8 | 95.3 |
| 2 | 331 | 0.2 | 135–80–72 | 3692 | 0.4 | 1.5 | 97.4 |
| 3 | 331 | 0.4 | 112–90–90 | 1360 | 1.1 | 2.2 | 95.2 |
| 4 | 71 | 0.2 | 180–180–120 | 5211 | 1.4 | 2.5 | 98.5 |
| 5 | 166 | 0.4 | 180–120–120 | 1690 | 1.0 | 3.3 | 95.0 |
| 6 | 166 | 1.0 | 180–120–120 | 197 | 1.4 | 4.1 | 90.7 |
| 7 | 166 | 0.4 | 163d | 2550 | 0.9 | 3.4 | 95.8 |
| 8 | 166 | 1.0 | 165d | 213 | 1.1 | 3.7 | 93.8 |
| 9e | 166 | 1.0 | 180–120–120 | 198 | 1.2 | 4.0 | 91.0 |
Concentration (for one addition) or total concentration (for three additions) of H2O2 in the starch mixture.
Time when H2O2 is added in one or three steps dropwise with equal concentration distribution.
Weight of isolated solid-oxidized starch product divided by the initial weight of starch on a dry basis.
H2O2 added with a syringe pump at 0.35 mL min–1.
Scale-up experiment of entry 6 with 1.0 kg of starch.
Blank experiments using only H2O2 (i.e., 0.31 mol L–1 H2O2, pH 10, 50 °C, 8 h, no FePcS catalyst) expectedly did not result in any significant carboxyl acid formation on starch products (DSCOOH = 0.48 per 100 AGU, which is close to the DS of 0.47 of native starch). An experiment with the FePcS catalyst, wherein all of the H2O2 was added to the starch suspension at once (i.e., the initial H2O2 concentration in the mixture is 0.3 M) with a batch time of 150 min and a relatively high catalyst intake (331 μM), gave a product with a low DSCOOH (0.7 per 100 AGU) and DSCO (0.8 per 100 AGU) and relatively high viscosity (7073 mPa·s) and product yield (95.3 wt %) (entry 1). The low degree of substitution is likely due to a high rate of H2O2 consumption by the catalyst (catalase activity), attributed to the high initial H2O2 concentration at the start of the reaction. Indeed, heavy foaming is observed when adding the full amount of H2O2 at once to the starch suspension due to decomposition to O2 and H2O.
To avoid H2O2 decomposition at the initial stage of the reaction, a subsequent experiment was performed with the stepwise addition of the H2O2 to reduce the concentration of H2O2 during the reaction (three additions, dropwise, entry 2). As a consequence, the batch time was increased from 150 to 450 min. Indeed, analyses of the product show that the starch is more efficiently oxidized and the amount of carbonyl groups is considerably higher (DSCO of 1.5 per 100 AGU) with a significant reduction in the product viscosity (3692 mPa·s). The product yield slightly improved to 97.4 wt %.
To further increase the degree of substitution and reduce the viscosity of the product, the amount of H2O2 added was increased 2-fold (entry 3). This step resulted in a DSCOOH of 1.1 and a DSCO of 2.2, already indicating that with a higher ratio of H2O2 to starch, products with a higher degree of substitution are obtained.
In the next step, attempts were made to reduce the catalyst intake (entries 4 and 5). When reducing the catalyst concentration by a factor of 2 (entry 5, 166 μM) compared to entry 3, the viscosity of the product is slightly higher, indicating a slightly lower extent of hydrolysis of the starch backbone. A major improvement regarding the extent of degradation and degree of substitution was observed when the total intake of H2O2 in the mixture is significantly increased at a fixed FePcS concentration (166 μM, entries 5 and 6; in entry 6, the H2O2/FePcS molar ratio is 6024). Oxidized starch with a high carbonyl content (DSCO of 4.1) is thus obtained at a modest starch loss of 9.3 wt %, with a DSCOOH of 1.4 in the desired range. Moreover, the viscosity decreased significantly to 197 mPa·s, which is well in the desired range for the industrial application (<500 mPa·s).
It can therefore be concluded from these experiments that the carbonyl and carboxyl contents of the oxidized starch product are determined to a large extent by properly controlling the concentration (e.g., by the total amount added and mode of addition) of the H2O2 during an experiment. Comparably, Tolvanen et al. reported starch oxidation with the FePcS–H2O2 system at rather similar experimental conditions (55 °C, pH 10, 420 min, 140 mg FePcS in 260 g starch), giving a product with a DSCOOH of 1.61 and a DSCO of 3.24 per 100 AGU at a moderate yield (67 wt %) (viscosity is not reported).22
The use of an even lower addition rate of H2O2 was tested by the continuous addition of H2O2 to the reactor using a syringe pump (entries 7 and 8). This method of addition resulted in a significant decrease in the reaction time to achieve the desired product properties in terms of viscosity and DSCOOH and DSCO. Initially, a relatively low H2O2 intake was tested, and this resulted in a higher starch viscosity and a lower degree of substitution (entry 7) when compared to a related experiment (entry 5). At a much higher H2O2 intake, a higher extent of starch degradation was obtained, as well as the expected higher levels of carbonyl and carboxyl group formations and a high starch recovery (entry 8).
To study the reproducibility at a larger scale, a batch reaction was performed with a considerably higher starch intake (1.0 kg) using the conditions as indicated in entry 6 (a H2O2/FePcS molar ratio of 6024, entry 9). Product properties (DSCOOH of 1.2 and DSCO of 4.0 per 100 AGU and a viscosity of 198 mPa·s) were close to the values obtained for the smaller-scale experiments.
Overall, these results clearly show that there is an intricate balance between the catalyst concentration and the rate and mode of addition of the H2O2 to achieve efficient oxidation. Furthermore, this catalyst appears to result in a relatively high carbonyl incorporation as compared to carboxyl formation when compared to oxidation by NaOCl. To study the latter, we performed reactions on model substrates (Section 2.2). Spectroscopic studies were also carried out to gain insights into the fate of the catalyst (i.e., rate of deactivation) during these oxidation reactions (Section 2.3).
2.2. Oxidation of Model Substrates
During starch oxidation, carbonyl and carboxyl groups at the polysaccharide backbone are formed. Additionally, the cleavage of the α-1,4-glycosidic bonds in the polysaccharide backbone by hydrolysis occurs, resulting in a reduction in the molecular weight and thus a lower viscosity of the final product. The water-soluble sugars formed by hydrolysis can also react with the oxidant to form low-molecular-weight carboxylic acids and other products. To gain more insight into the relative reactivity of the different chemical motifs and the factors that determine selectivity during the catalytic oxidation of starch with the FePcS–H2O2 system, simple model compounds (i.e., sugars) were examined and the results are summarized in Table 2.
Table 2. Catalytic Oxidation of Sugars with H2O2 and FePcS Catalyst at 50 °C.
| yield (mol %) |
||||||||||
|---|---|---|---|---|---|---|---|---|---|---|
| no. | substrate | substrate (mM) | FePcS (μM) | H2O2 (mol equiv) | time (h) | pH before | pH after | conversion (mol %) | FRU | FA |
| 1 | d-glucose | 49 | 0 | 0 | 16 | 10.7 | 10.2 | 15 | 14 | nda |
| 2 | d-glucose | 49 | 0 | –b | 16 | 10.2 | 9.8 | 9 | 3 | 3 |
| 3 | d-glucose | 47 | 28 | 1 | 16 | 10.6 | 9.9 | 39 | 20 | 32 |
| 4 | d-glucose | 47 | 28 | 2 | 16 | 10.5 | 9.8 | 33 | 16 | 34 |
| 5 | d-glucose | 46 | 27 | 3 | 16 | 10.9 | 9.8 | 35 | 14 | 55 |
| 6 | d-glucose | 46 | 37 | 1 | 23 | 9.5 | 9.1 | 19 | 6 | 11 |
| 7 | d-glucose | 47 | 35 | 1 | 23 | 10.5 | 9.9 | 53 | 21 | 44 |
| 8 | d-glucose | 48 | 77 | 2 | 16 | 10.4 | 9.7 | 32 | 15 | 31 |
| 9 | d-glucose | 47 | 115 | 2 | 16 | 10.6 | 9.7 | 36 | 17 | 38 |
| 10 | d-glucose | 48 | 154 | 2 | 16 | 10.5 | 9.8 | 34 | 17 | 29 |
| 11 | α-MGP | 44 | 36 | 1 | 23 | 10.5 | 10.5 | 2 | nd | nd |
| 12 | d-sorbitol | 46 | 36 | 1 | 23 | 10.5 | 10.3 | 4 | nd | 16 |
| 13 | d-cellobiose | 47 | 35 | 1 | 23 | 10.5 | 9.7 | 49 | 46c | 55 |
| 14 | d-cellobiose | 46 | 27 | 1 | 23 | 10.5 | 9.7 | 47 | 25c | 34 |
| 15 | d-cellobiose | 46 | 27 | 2 | 23 | 10.5 | 9.6 | 42 | 31c | 29 |
| 16 | d-cellobiose | 46 | 27 | 3 | 23 | 10.6 | 9.6 | 40 | 37c | 61 |
nd means not detected in HPLC.
1.76 μM H2O2.
Total yield of d-glucose and isomerization products.
Initial experiments with d-glucose were performed at 50 °C. A blank reaction (no FePcS catalyst, no H2O2, pH 10.7) with only the substrate present resulted in a 15 mol % glucose conversion and the formation of d-fructose (FRU) as a result of a base-catalyzed isomerization of d-glucose (entry 1).29−31 In the presence of H2O2 (added dropwise in 1 h), although in the absence of catalyst, a 9 mol % conversion of d-glucose to d-fructose as well as formic acid (FA) (3 mol %) was observed (entry 2). The formation of FA is likely due to the oxidation reaction of glucose with HOO– as reported earlier by Sato and co-workers using a Mg/Al hydrotalcite catalyst in combination with H2O2 (Figure S3).32
In the glucose oxidation experiments using the FePcS catalyst, C6-organic acids (e.g., glucuronic, gluconic, and glucaric acids) were not detected, indicating that this catalytic system is not very active for the oxidation of the C6-OH motif. The only carboxylic acid formed was formic acid, whereas other small acids like acetic, lactic, and propanoic acids were not detected (HPLC) under the prevailing reaction conditions. For the oxidation of starch, the formation of water-soluble C6-carboxylic acids was also not observed (Section 2.1). However, for the latter, not only formic acid but also smaller amounts of glycolic acid, oxalic acid, and 2,3-dihydroxypropanic acid were detected, in line with literature data.20,22 These differences in results for the composition of water-soluble compounds between glucose and starch suggest a difference in the selectivity of the oxidation reaction between both substrates when using the FePcS–H2O2 system. Catalytic oxidation of glucose into formic acid with the use of H2O2 as the oxidant over metal catalysts has been reported under mild, basic conditions.33−35 Formic acid formation is rationalized by assuming that in the presence of a base, the selective oxidation at the C1 position of aldoses is favored. The catalytic conditions lead to the formation of additional aldehydes and after oxidation formic acid, via the C1–C2 bond cleavage. This present work shows that glucose oxidation yields formic acid (suggesting α-oxidation), whereas starch oxidation yields formic and oxalic acids, suggesting that formic acid may be formed from oxalic acid (β-oxidation), as previously described in the literature.33
Additional experiments with d-glucose were performed at 50 °C with a similar initial concentration of d-glucose (46–49 mM), albeit with different catalyst concentrations (27–154 μM), batch times (16–23 min), and initial pH values (between 9.5 and 10.9) (Table 2). When using low concentrations of FePcS in combination with 3-mole equivalents of H2O2, the conversion of d-glucose (33–39 mol %) and the yield of FA increased significantly (32–35 mol %) (entries 3–5). Furthermore, a small change in the initial pH appeared to have a significant effect on the conversion of d-glucose (19–53 mol %) and the yield of FA (11–44 mol %) (entries 6 and 7). The concentration of FePcS had a limited effect on the conversion of d-glucose and the formation of FA (entries 8–12). The reason for this limited influence is likely due to the degradation of the FePcS catalyst (vide infra), which could be attributed to high initial catalase activity, as similarly observed in starch oxidation (Section 2.1).
Under the same oxidation conditions, nonreducing sugars including α-methyl-d-glucopyranoside (α-MGP) and d-sorbitol showed to be mostly inert (entries 11 and 12). However, a reducing sugar like d-cellobiose appears to be hydrolyzed to d-glucose, which is subsequently isomerized to d-fructose and d-mannose, coupled with the formation of FA (entries 13–16).
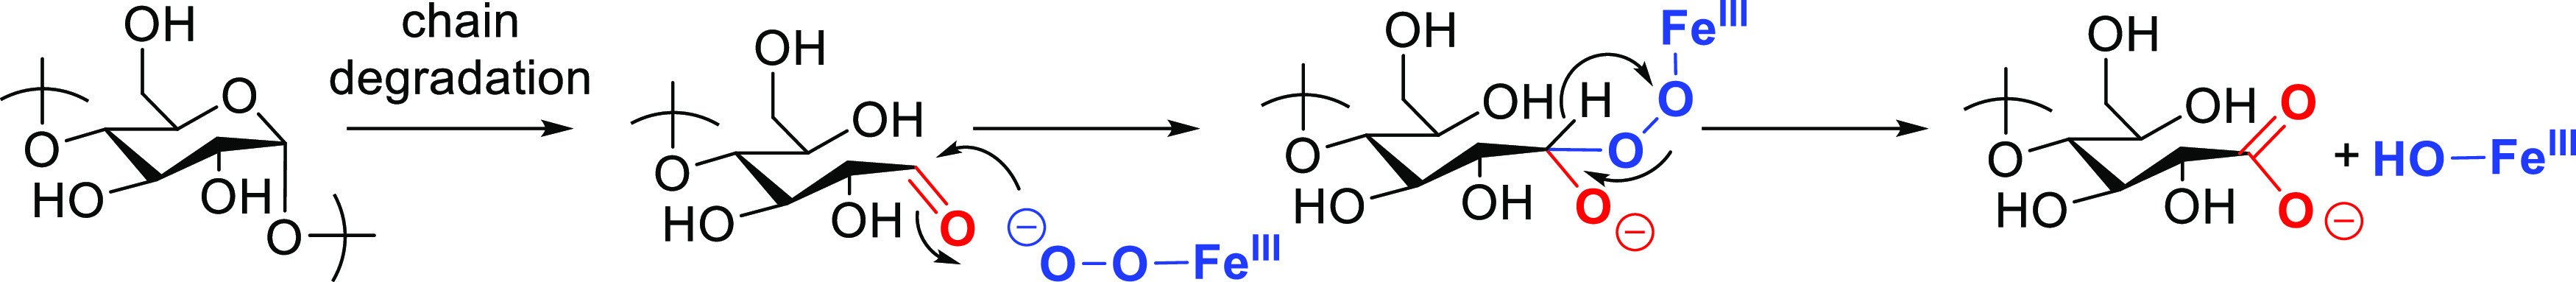
These results confirm the relatively low activity of this catalytic system for C6 oxidation (primary alcohol oxidation), indicating that the formed carboxylic acid groups likely arise from partial decomposition and subsequent aldehyde oxidation to carboxylic acids (Scheme 2).
Scheme 2. Proposed Mode of Action of FePcS for Carboxyl Formation.
2.3. Stability of the FePcS Complex under Oxidative Conditions
The rate of the addition of H2O2 significantly influenced the outcome of the starch oxidation reaction (see Section 2.1 for details). Significant bubble formation indicated catalase activity upon addition, which was less significant at later additions, strongly indicating changes to the catalysts during the process. Therefore, the stability of the FePcS complex under oxidative conditions was assessed to study changes in the catalyst under actual reaction process conditions and identify the possible rate of deactivation. For this purpose, UV–vis and Raman spectroscopic analyses were performed. The former technique was applied for the FePcS–H2O2 system in the absence of starch or starch model compounds, whereas the latter was used in the presence of substrates, thus providing new insights into the fate of the catalyst under starch oxidation conditions.
2.3.1. UV–Vis Spectroscopy
Aqueous solutions of the FePcS complex were prepared (23 μM) and treated with H2O2 (at H2O2/FePcS molar ratios of 0.75:1 and 1.51:1) in near-neutral (pH 7.6) and basic media (pH 10.0), and the samples were measured by UV–vis spectrometry as a function of time. The catalyst in the absence of H2O2 shows two strong absorption bands, which are assigned to the σ → σ* (B-band, UV region) and π → π* (Q-band, visible region) transitions within the heteroatomic units of the FePcS complex (Figure S4).
Upon the dropwise addition of H2O2 (H2O2/FePcS molar ratio of 0.75:1), a decrease in the absorbance of the Q-band was observed a few minutes after starting the H2O2 addition. This effect was stronger at a higher pH value (Figure 2). When the normalized absorbance is plotted as a function of time, it becomes apparent that the progressive decrease in absorbance is strongly influenced by the initial H2O2 and OH– concentrations (Figure S5). Moreover, the addition of an excess H2O2 (H2O2/FePcS molar ratio of 1.5:1) resulted in a larger shift of the Q-band from a λmax of 632–637 nm at pH 10.0, accompanied by discoloration of the deep-blue solution, indicating changes to the catalyst chemical structure. Hadasch et al. attributed these absorptions to the formation of a dimeric μ-bridged PcSFeIII–O–FeIIIPcS (632 nm), of which the structure has been reported,37 and a mononuclear PcSFeIII–OH (637 nm) compound.36 This progressive transformation of the μ-oxo dimer to the monomeric FePcS species is known to result in a decrease in the catalytic performance,17,38 indicating that the latter is not catalytically active and thus a clear indication of catalyst deactivation.
Figure 2.

Spectra of the FePcS complex in water (23 μM) in the visible region with added H2O2 (H2O2/FePcS molar ratio of 0.75:1, room temperature) as a function of time at pH (a) 7.6 and (b) 10.0.
The decrease in absorbance upon the addition of 0.75 and 1.51 equiv of H2O2 at pH 10 of the Q-band was approximately 15 and 30% after 15 min, respectively. At neutral conditions, however, the absorbance of the Q-band decreased only by 20% after 15 min (1.51 equiv of H2O2). Lowering the amount of H2O2 added resulted in a smaller decrease in the absorbance of ∼10%. Consequently, the FePcS conversion rate is retarded when using a lower H2O2 intake. This result implies that the conversion of the dimeric PcSFeIII–O–FeIIIPcS to the mononuclear PcSFeIII–OH is retarded at low H2O2 concentrations. In fact, a high H2O2 concentration with respect to the FePcS catalyst (>10:1 molar ratio) had been shown previously to result in a brown solid residue appearing at the reactor wall when using a very small amount of starch (solid-to-liquid ratio of 1:24) or no starch at all (Figure S6).38 The residue was most likely formed due to fast catalyst deactivation leading to iron-containing precipitate at high H2O2 concentration in the absence of starch. These results indicate that the catalyst is particularly sensitive to structural changes and decomposition at conditions of high pH and high H2O2 concentration.
2.3.2. Raman Spectroscopy
The stability of the FePcS complex was further assessed by Raman spectroscopy. This technique is a versatile tool for operando probing of the state of the phthalocyanine motif in aqueous media, though the fluorescent nature of the phthalocyanine motif renders the analysis challenging. This issue was circumvented by carefully selecting a suitable excitation wavelength. Of several excitation wavelengths tested, the 785 nm wavelength showed the least intense fluorescence with a good overall signal for FePcS. Two well-resolved peaks were obtained, one between 1300 and 1360 cm–1, attributed to the C=C stretch of the benzene ring, and another between 726 and 764 cm–1 (Figure 3) due to C–H wagging (FePcS macrocycle out-of-plane).39 Based on its higher intensity, the first one was selected to monitor the conversion of FePcS as a function of time. Figure S7 shows that the conversion of FePcS in the presence of 0.1 M H2O2 (initial concentration) at pH 10.0 is independent of the initial FePcS concentration. For instance, the FePcS conversion after 120 min was found to be almost the same (about 70%) in all four FePcS concentrations tested (i.e., H2O2/FePcS molar ratios of 386, 602, 599, and 122). This result implies that the conversion of the initial catalyst is first order with respect to FePcS, which indicates that dimer formation is not the main conversion route under these conditions.
Figure 3.

Band assignments for FePcS, H2O2, sucrose (model substrate), and Na2SO4 (internal standard) at pH 10.0 and λex = 785 nm using in situ Raman spectroscopy.
The influence of H2O2 concentration on the FePcS conversion in the presence of sucrose (0.1 M) as a model substrate was then investigated (Figure 4). Upon the addition of FePcS to a H2O2-containing sucrose solution (0.1 M) at pH 10.0 and 20 °C using three different H2O2/FePcS molar ratios (348, 578, and 1329), the formation of bubbles and partial discoloration occur rapidly (order of 1 min), although precipitation was not observed. After this initial reaction phase (i.e., initial burst), the concentration of the remaining FePcS was followed over time. After a reaction of 100 min, the FePcS conversion was found to be ∼60% (H2O2/FePcS molar ratio of 348:1). A higher ratio (1329:1) led to an increased FePcS conversion over time. The H2O2 peak could not be detected anymore after the reaction, suggesting complete conversion. Most of the H2O2 (>90%) was actually consumed in the initial stage, suggesting that indeed in the initial reaction phase, rapid H2O2 decomposition occurs. This result is in line with the observation of catalase activity at high doses of H2O2 in the starch reactions. Negligible conversion of H2O2 was observed without the added FePcS catalyst, implying good stability of the peroxide under reaction conditions. Interestingly, the presence of sucrose did not have a significant effect on the FePcS conversion (Figure S8).
Figure 4.

Conversion of FePcS at different H2O2/FePcS molar ratios with 0.1 M sucrose at pH 10.0 and 20 °C.
When a higher amount of H2O2 was used, the initial burst occurs at a time scale of seconds (instead of minutes at low intake). Besides, a high initial conversion of FePcS of 66% was detected for a H2O2/FePcS molar ratio of 1329:1 (as compared to 48% for 348:1 molar ratio; Figure 5). This observation is in line with the UV–vis spectroscopy results and shows that the FePcS conversion is increased at a higher H2O2 concentration. After the initial stage, the conversion of FePcS continued over time albeit at a much lower rate. At this stage, the extent of FePcS degradation becomes only slightly dependent on the H2O2/FePcS molar ratio. At a low H2O2/FePcS molar ratio, for example, the conversion of the remaining FePcS was 65%. This conversion is comparable to 75%, which is the FePcS conversion for a much higher (4-fold) H2O2/FePcS molar ratio. These results strongly suggest that the stability of the FePcS catalyst is mainly influenced by this initial reaction phase leading to significant decomposition and low oxidation efficiency, as observed in the starch reactions. It is likely that the PcS ligand becomes oxidatively degraded in the presence of high H2O2 concentration, as demonstrated previously, leading to an inactive catalytic system.38
Figure 5.

FePcS conversion during the initial reaction phase and after 120 min for different H2O2/FePcS molar ratios with 0.1 M sucrose at pH 10.0 and 20 °C.
The influence of reaction temperature, an important parameter in catalytic starch oxidation, on the stability of FePcS catalyst when using an excess of H2O2 was then investigated. When the temperature is increased, the extent of bubble formation and discoloration becomes more apparent (Figure 6). For example, the FePcS conversion after the initial reaction phase increased from 38 to 62% at 20 and 40 °C, respectively, at a constant H2O2/FePcS molar ratio. The conversion of the remaining FePcS was again monitored as a function of time. The extent of the FePcS degradation in the second stage was found to be only slightly influenced by temperature (Figure S9), which is similar to the effects observed with varying H2O2 concentrations after the initial burst.
Figure 6.

Initial burst (initial reaction phase) and FePcS conversion after 60 min for different temperatures at pH 10.0 with 0.1 M H2O2 in the absence of sucrose.
The subsequent conversion of FePcS following the initial burst was 32% for both 30 and 40 °C and 40% for 20 °C (Figure 7). This higher conversion can be explained by the relatively milder initial burst that occurred at 20 °C, allowing for more active FePcS to remain in solution. Notably, with an increase in temperature, full conversion of FePcS is observed, strongly indicating that it is already fully degraded at 40 °C after 60 min.
Figure 7.

Conversion of the FePcS catalyst (250 μM) at different reaction temperatures with 0.1 M H2O2 at pH 10.0 and temperatures of 20, 30, and 40 °C.
Overall, it is clear that a combination of process parameters such as pH values, temperatures, levels of oxidants and catalysts, and the nature of the substrates used will strongly influence the extent of catalyst degradation and thus catalyst efficiency. As efficient starch oxidation experiments were carried out at 50 °C and relatively high oxidant concentrations, degradation of the FePcS catalyst is expected to occur to a great extent. This work shows that careful control of the catalyst and H2O2 concentration is essential for efficient catalytic oxidation as the rates of oxidative degradation of the metal–ligand complex need to be balanced with the desired starch degradation and oxidation. At too high concentrations, oxidative degradation seems to be favored without necessarily improving substrate oxidation rates, which could have to do with the need for the release of reactive groups by chain degradation, as detailed in Scheme 2. This balance was indeed observed in the reactions on starch where slow addition of H2O2 at low FePcS catalyst concentration provided the most efficient oxidation in terms of the degree of substitution per amount of catalyst.
3. Conclusions
In this work, the “clean”, single-step oxidative modification of native potato starch by H2O2 catalyzed by low loadings of water-soluble iron(III) phthalocyanine (FePcS) was investigated in detail to provide insight into the interplay between catalyst activity, selectivity, and stability. After the process condition screening, oxidized starch with comparable properties as obtained with NaOCl benchmark (relatively high DSCO and low viscosity) was achieved at a modest starch loss. Complementary oxidation experiments with model compounds provided insights into the oxidation pathways for starch oxidation, which showed that the catalyst used has a low activity for C6 primary alcohol oxidation and favors the oxidation of aldehydes following the C–C bond breakage leading to the formation of formic acid.
UV–vis and Raman spectroscopic techniques were used to monitor the stability of the FePcS catalyst as a function of time under oxidative conditions to assess potential improvements in the efficient application of this catalyst. UV–vis spectroscopy results showed that the FePcS catalyst is particularly sensitive to structural changes and decomposition at elevated pH and H2O2 concentrations. Raman spectroscopy studies show that the FePcS catalyst degrades over time and the rate and extent of degradation were strongly dependent on the levels of H2O2, catalyst, and the temperature of the reaction. Even though excessive catalyst degradation is revealed, catalyst lifetime can be extended by carefully controlling the temperature, catalyst concentration, and, in particular, the mode of addition of H2O2, leading to a relatively efficient starch oxidation. Fully overcoming catalyst degradation is difficult when such systems require the use of organic ligands that can decompose under oxidative conditions but could be a starting point for future catalytic metal complex design and development.
Thus, even though full recycling in reaction solutions will be unfeasible, the control of reaction conditions can overcome the problem of catalyst decomposition in the oxidation of starch with FePcS. A process based on this catalytic system will require careful control of the dosing of H2O2 to allow the most efficient use of the catalyst at low loadings, while increased loadings will not achieve linear improvements. These insights are crucial in the understanding of, among others, the problem of FePcS decomposition in relation to the commercial operation of such a process and can hopefully further guide the rational catalyst design and implementation in the future.
4. Materials and Methods
4.1. Materials
Native potato starch (moisture content of ∼16 wt %) was kindly provided by Avebe (The Netherlands) and was used as received. H2O2 (30 wt %) and NaOH were purchased from Merck. The water-soluble iron tetrasulfophthalocyanine complex was prepared by a modified Weber–Busch procedure, as described previously.25,26 All chemicals including d-glucose, d-fructose, d-sorbitol, α-methyl-d-glucopyranoside, d-cellobiose, d-mannose, d-arabinose, and formic acid were of reagent grade (Sigma-Aldrich) and used as received without any further purification. All other reagents are of commercial grade and used as received unless stated otherwise.
4.2. Catalytic Oxidation of Potato Starch and Model Substrates
The setup used for the catalytic oxidation of potato starch and model compounds are presented in Figure S2. Typically, a 39 wt % potato starch (dry basis) slurry in deionized distilled water was prepared and heated to the desired temperature using a thermostat bath. The pH of the suspension was adjusted to the desired pH by the addition of a 1.1 M NaOH solution, after which the FePcS catalyst was added to the suspension. The reaction was started by the addition of H2O2, of which the exact intake was varied. The pH was controlled using a Tiamo Titrando 569 pH-stat by the addition of a NaOH solution. Peroxide test strips were used to determine when all of the H2O2 was converted, after which the next batch of H2O2 was added. After the reaction, the suspension was neutralized to a pH of 5.5 using a 10 N H2SO4 solution. The neutralized suspension was filtered over a Buchner funnel and washed with 2–5 L deionized water and dried in an oven at 30–40 °C overnight. The starch loss was calculated based on the product yield and adjusted for the difference in moisture content.
4.3. Determination of Product Properties
The moisture content was determined using a Kern moisture analyzer model DBS 60-3, and the urea viscosity of the oxidized starch was determined using a Rapid Visco-Analyzer. For the latter, deionized water was added to 9.0 g of dry oxidized starch to a total weight of 15.0 g. A urea solution (40 wt %) was then added to reach an end weight of 33.0 g.
The carboxyl content was determined titrimetrically according to the modified procedure of Chattopadhyay et al.27 Typically, 2.5 g of dried starch was suspended in 50 mL of 0.1 M HCl with stirring for 30 min at room temperature. The product was vacuum-filtered through a fritted glass funnel, washed with deionized water (2 L), and dissolved in 200 mL of boiling water. The starch slurry was heated in a boiling water bath with continuous stirring for 15 min to ensure complete gelatinization. The starch solution was cooled to 40–50 °C and was titrated with a standard 0.1 M NaOH solution using phenolphthalein as an indicator. The degree of carboxyl substitution (DSCOOH) was expressed as the number of carboxyl groups per 100 AGU calculated using eq 1
| 1 |
The carbonyl content was also determined using a titrimetric method, following the procedure of Smith28 with minor modifications. Oxidized starch (1.0 g) was added into 40 mL of deionized water in a 250 mL flask. The starch was dissolved by heating to 100 °C in a boiling water bath with fast stirring for approximately 20 min. The solution was cooled to 40 °C. After cooling, the pH was adjusted to 3.2 with a 0.1 M HCl solution and then mixed with 25 mL of a solution with the hydroxylamine. The hydroxylamine reagent was prepared by first dissolving 5.0 g of hydroxylamine hydrochloride in 20 mL of 0.5 M NaOH, followed by the addition of deionized water to a final volume of 100 mL. The starch solution was heated to 40 °C for 4 h with occasional stirring. The excess hydroxylamine was determined by rapidly titrating the reaction mixture to pH 3.2 with a standardized 0.1 M HCl solution. A blank determination was performed in the same manner using only the hydroxylamine reagent. The degree of carbonyl substitution (DSCO) (CO per 100 AGU) was calculated using eq 2
| 2 |
where Vb is the volume of HCl used to test the blank (mL), Vs is the volume of HCl required for the sample (mL), M is the molarity of HCl, and W is the sample weight (g, dry basis).
Titrimetric and viscosity measurement results were found to be reproducible with errors within 0.2 groups per 100 AGU.
4.4. Catalyst Stability Studies Using UV–Vis and Raman Spectroscopy
UV–vis absorption spectroscopy was carried out using a ThermoSpectronic Aquamate UV–Vis spectrometer. Online reaction monitoring with Raman spectroscopy was performed on a PerkinElmer RamanStation 400 benchtop Raman spectrometer (350 mW near-infrared 785 nm laser delivering 100 mW at the sample), which was coupled with a standard Raman fiber probe at an excitation wavelength of 785 nm. The internal response factor (IRF) in Raman of the FePcS complex with Na2SO4 as the internal standard (IS) was calculated using eq 3
| 3 |
where CIS is the concentration of the internal standard, Na2SO4 (M), and CFePcS is the concentration of the catalyst, FePcS (M).
The IRF was determined to be 819.9 for FePcS. The concentration of FePcS was calculated using eq 4
| 4 |
The conversion of FePcS was then calculated using eq 5
| 5 |
The conversion of FePcS during the initial reaction phase was calculated using eq 6
| 6 |
where CFePcS,added is the concentration of the FePcS added (M) and CFePcS,0 is the concentration of the FePcS directly after addition to the mixture (M).
Acknowledgments
This chlorine-free starch oxidation work is part of a collaborative project between the University of Groningen and Avebe. Financial support from Samenwerkingsverband Noord-Nederland (SNN), as part of the project Transitie II, Pieken in de delta, project T3003 Duurzaam & kostenefficiënt productieproces zetmeel, is gratefully acknowledged. P.J.D. and J.O.P.B. acknowledge funding via the carbobased research program “A greener starch oxidation”. The carbobased research program is cofinanced by the “SNN, Ruimtelijk Economisch Programma” and coordinated by the Carbohydrate Competence Center (www.cccresearch.nl). The authors furthermore acknowledge the financial support of Avebe for this research program.
Supporting Information Available
The Supporting Information is available free of charge at https://pubs.acs.org/doi/10.1021/acsomega.1c01407.
Reaction pathways and mechanisms proposed in the literature, the reaction setup, and additional UV–vis and Raman spectroscopy data (PDF)
The authors declare no competing financial interest.
Supplementary Material
References
- Tharanathan R. N. Starch—value addition by modification. Crit. Rev. Food Sci. Nutr. 2005, 371–384. 10.1080/10408390590967702. [DOI] [PubMed] [Google Scholar]
- Chiu C.; Solarek D.. Chapter 17 - Modification of Starches. In Starch, 3rd ed.; BeMiller J.; Whistler R., Eds.; Academic Press: San Diego, 2009; pp 629–655. [Google Scholar]
- Ellis R. P.; Cochrane M. P.; Dale M. F. B.; Duffus C. M.; Lynn A.; Morrison I. M.; Prentice R. D. M.; Swanston J. S.; Tiller S. A. Starch production and industrial use. J. Sci. Food Agric. 1998, 289–311. . [DOI] [Google Scholar]
- Burrell M. M. Starch: the need for improved quality or quantity—an overview. J. Exp. Bot. 2003, 451–456. 10.1093/jxb/erg049. [DOI] [PubMed] [Google Scholar]
- Sangseethong K.; Lertphanich S.; Sriroth K. Physicochemical properties of oxidized starch prepared under various alkalinity levels. Starch - Stärke 2009, 92–100. 10.1002/star.200800048. [DOI] [Google Scholar]
- Forssell P.; Hamunen A.; Autio K.; Suortti T.; Poutanen K. Hypochlorite oxidation of barley and potato starch. Starch - Stärke 1995, 371–377. 10.1002/star.19950471002. [DOI] [Google Scholar]
- Maurer H. W.; Kearney R. L. Opportunities and challenges for starch in the paper industry. Starch - Stärke 1998, 396–402. . [DOI] [Google Scholar]
- Komulainen S.; Verlackt C.; Pursiainen J.; Lajunen M. Oxidation and degradation of native wheat starch by acidic bromate in water at room temperature. Carbohydr. Polym. 2013, 93, 73–80. 10.1016/j.carbpol.2012.06.001. [DOI] [PubMed] [Google Scholar]
- Komulainen S.; Verlackt C.; Pursiainen J.; Lajunen M. Oxidation and degradation of native wheat starch by acidic bromate in water at room temperature. Carbohydr. Polym. 2013, 93, 73–80. 10.1016/j.carbpol.2012.06.001. [DOI] [PubMed] [Google Scholar]
- Patel K. F.; Mehta H. U.; Srivasta H. Kinetics and mechanism of oxidation of starch with sodium hypochlorite. J. Appl. Polym. Sci. 1974, 18, 389–399. 10.1002/app.1974.070180207. [DOI] [Google Scholar]
- Fraschini C.; Vignon M. R. Selective oxidation of primary alcohol groups of β-cyclodextrin mediated by 2,2,6,6-tetramethylpiperidine-1-oxyl radical (TEMPO). Carbohydr. Res. 2000, 585–589. 10.1016/S0008-6215(00)00129-4. [DOI] [PubMed] [Google Scholar]
- Kato Y.; Matsuo R.; Isogai A. Oxidation process of water-soluble starch in TEMPO-mediated system. Carbohydr. Polym. 2003, 69–75. 10.1016/S0144-8617(02)00159-5. [DOI] [Google Scholar]
- Chang P. S.; Park K. O.; Shin H. K.; Suh D. S.; Kim K. O. Physicochemical properties of partially oxidized corn starch from bromide-free TEMPO-mediated reaction. J. Food Sci. 2008, 73, C173–C178. 10.1111/j.1750-3841.2008.00682.x. [DOI] [PubMed] [Google Scholar]
- Bragd P. L.; van Bekkum H.; Besemer A. C. TEMPO-mediated oxidation of polysaccharides: survey of methods and applications. Top. Catal. 2004, 27, 49–66. 10.1023/B:TOCA.0000013540.69309.46. [DOI] [Google Scholar]
- Kochkar H.; Morawietz M.; Holderich W. F. Oxidation of potato starch with NO2: characterization of the carboxylic acid salts. Appl. Catal., A 2001, 210, 325–328. 10.1016/S0926-860X(00)00815-2. [DOI] [Google Scholar]
- Sorokin A.; Kachkarova-Sorokina S.; Donze C.; Pinel C.; Gallezot P. From native starch to hydrophilic and hydrophobic products: a catalytic approach. Top. Catal. 2004, 27, 67–76. 10.1023/B:TOCA.0000013541.48636.b4. [DOI] [Google Scholar]
- Sorokin A. B. Phthalocyanine metal complexes in catalysis. Chem. Rev. 2013, 113, 8152–8191. 10.1021/cr4000072. [DOI] [PubMed] [Google Scholar]
- Grootboom N.; Nyokong T. Iron perchlorophthalocyanine and tetrasulfothalocyanine catalyzed oxidation of cyclohexane using hydrogen peroxide, chloroperoxybenzoic acid and tert-butylhydroperoxide as oxidants. J. Mol. Catal. A: Chem. 2002, 179, 113–123. 10.1016/S1381-1169(01)00404-6. [DOI] [Google Scholar]
- Kachkarova-Sorokina S. L.; Gallezot P.; Sorokin A. B. A novel clean catalytic method for waste-free modification of polysaccharides by oxidation. Chem. Commun. 2004, 24, 2844–2845. 10.1039/b411694a. [DOI] [PubMed] [Google Scholar]
- Tolvanen P.; Sorokin A.; Maki-Arvela P.; Murzin D. Y.; Salmi T. Oxidation of starch by H2O2 in the presence of iron tetrasulfophthalocyanine catalyst: the effect of catalyst concentration, pH, solid-liquid ratio, and origin of starch. Ind. Eng. Chem. Res. 2013, 9351–9358. 10.1021/ie4003969. [DOI] [Google Scholar]
- Tolvanen P.; Sorokin A.; Maki-Arvela P.; Leveneur S.; Murzin D. Y.; Salmi T. Batch and semibatch partial oxidation of starch by hydrogen peroxide in the presence of an iron tetrasulfophthalocyanine catalyst: the effect of ultrasound and the catalyst addition policy. Ind. Eng. Chem. Res. 2011, 749–757. 10.1021/ie100868k. [DOI] [Google Scholar]
- Tolvanen P.; Maki-Arvela P.; Sorokin A. B.; Salmi T.; Murzin D. Y. Kinetics of starch oxidation using hydrogen peroxide as an environmentally friendly oxidant and an iron complex as a catalyst. Chem. Eng. J. 2009, 154, 52–59. 10.1016/j.cej.2009.02.001. [DOI] [Google Scholar]
- Salmi T.; Tolvanen P.; Warna J.; Maki-Arvela P.; Murzin D.; Sorokin A. Mathematical modelling of starch oxidation by hydrogen peroxide in the presence of an iron catalyst complex. Chem. Eng. Sci. 2016, 19–25. 10.1016/j.ces.2016.02.027. [DOI] [Google Scholar]
- Klein-Koerkamp C.; Granet R.; Zerrouki R.; Villandier N.; et al. Efficient oxidative modification of polysaccharides in water using H2O2 activated by iron sulfophthalocyanine. Carbohydr. Polym. 2009, 78, 938–944. 10.1016/j.carbpol.2009.07.021. [DOI] [Google Scholar]
- Weber J. H.; Busch D. H. Complexes derived from strong field Ligands. XIX. Magnetic properties of transition metal derivatives of 4,4′,4″,4‴- tetrasulfophthalocyanine. Inorg. Chem. 1965, 4, 469. 10.1021/ic50026a007. [DOI] [Google Scholar]
- Hadasch A.; Sorokin A.; Rabion A.; Fraisse L.; Meunier B. Oxidation of 2,4,6-trichlorophenol (TCP) catalyzed by iron tetrasulfophthalocyanine (FePcS) supported on a cationic ion-exchange resin. Bull. Soc. Chim. Fr. 1997, 134, 1025–1032. [Google Scholar]
- Chattopadhyay S.; Singal R. S.; Kulkarni P. R. Optimisation of conditions of synthesis of oxidised starch from corn and amaranth for use in film-forming applications. Carbohydr. Polym. 1997, 34, 203–212. 10.1016/S0144-8617(97)87306-7. [DOI] [Google Scholar]
- Smith R. J.Characterization and Analysis of Starches. In Starch Chemistry and Technology, Vol. II; Whistler R. L.; Paschall E. F., Eds.; Academic Press: New York, 1967; pp 620–625. [Google Scholar]
- Kuakpetoon D.; Wang Y.-J. Locations of hypochlorite oxidation in corn starches varying in amylose content. Carbohydr. Res. 2008, 343, 90–100. 10.1016/j.carres.2007.10.002. [DOI] [PubMed] [Google Scholar]
- Isbell H. S.; Frush H. L. Mechanisms for hydroperoxide degradation of disaccharides and related compounds. Carbohydr. Res. 1987, 161, 181–193. 10.1016/S0008-6215(00)90076-4. [DOI] [Google Scholar]
- Delidovich I.; Palkovits R. Catalytic isomerization of biomass-derived aldoses: a review. ChemSusChem 2016, 9, 547–561. 10.1002/cssc.201501577. [DOI] [PMC free article] [PubMed] [Google Scholar]
- Sato R.; Choudhary H.; Nishimura S.; Ebitani K. Synthesis of formic acid from monosaccharides using calcined Mg-Al hydrotalcite as reusable catalyst in the presence of aqueous hydrogen peroxide. Org. Process Res. Dev. 2015, 449–453. 10.1021/op5004083. [DOI] [Google Scholar]
- Zhang Z.; Huber G. W. Catalytic oxidation of carbohydrates into organic acids and furan chemicals. Chem. Soc. Rev. 2018, 47, 1351–1390. 10.1039/C7CS00213K. [DOI] [PubMed] [Google Scholar]
- Calvo L.; Vallejo D. Formation of organic acids during the hydrolysis and oxidation of several wastes in sub- and supercritical water. Ind. Eng. Chem. Res. 2002, 41, 6503–6509. 10.1021/ie020441m. [DOI] [Google Scholar]
- Jin F. M.; Yun J.; Li G.; Kishita A.; Tohji K.; Enomoto H. Hydrothermal conversion of carbohydrate biomass into formic acid at mild temperatures. Green Chem. 2008, 10, 612–615. 10.1039/b802076k. [DOI] [Google Scholar]
- Hadasch A.; Sorokin A.; Rabion A.; Meunier B. Sequential addition of H2O2, pH and solvent effects as key factors in the oxidation of 2,4,6-trichlorophenol catalyzed by iron tetrasulfophthalocyanine. New J. Chem. 1998, 22, 45–51. 10.1039/a706741k. [DOI] [Google Scholar]
- Stuzhin P. A.; Ivanova S. S.; Dereven’kov I.; Makarov S. V.; Silaghi-Dumitrescu R.; Homborg H. First water-soluble μ-nitrido dimer of iron phthalocyanine. Macroheterocycles 2012, 5, 175–177. 10.6060/mhc2012.120360s. [DOI] [Google Scholar]
- d’Alessandro N.; Tonucci L.; Bressan M.; Dragani L. K.; Morvillo A. Rapid and selective oxidation of metallosulfophthalocyanines prior to their usefulness as precatalysts in oxidation reactions. Eur. J. Inorg. Chem. 2003, 1807–1814. 10.1002/ejic.200200620. [DOI] [Google Scholar]
- Volpati D.; Alessio P.; Zanfolim A. A.; Storti F. C.; Job A. E.; Ferreira M.; Riul A. Jr.; Oliveira O. N. Jr.; Constantino C. J. L. Exploiting distinct molecular architectures of ultrathin films made with iron phthalocyanine for sensing. J. Phys. Chem. B 2008, 112, 15275–15282. 10.1021/jp804159h. [DOI] [PubMed] [Google Scholar]
Associated Data
This section collects any data citations, data availability statements, or supplementary materials included in this article.