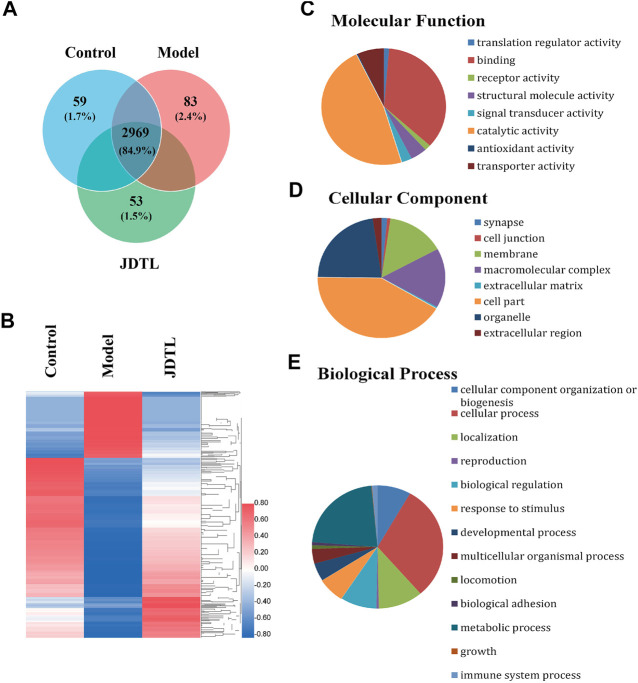
FIGURE 5.
Summary statistics of LC-MS/MS analysis. (A) Area-proportional Venn diagram depicts the overlap of the identified proteins of Control, Model, and JDTLG groups. (B) Heat map analysis of the DAPs among the three groups. (C–E) Molecular functional assignments, cellular component and biological process of the DAPs according to gene ontology analysis.

