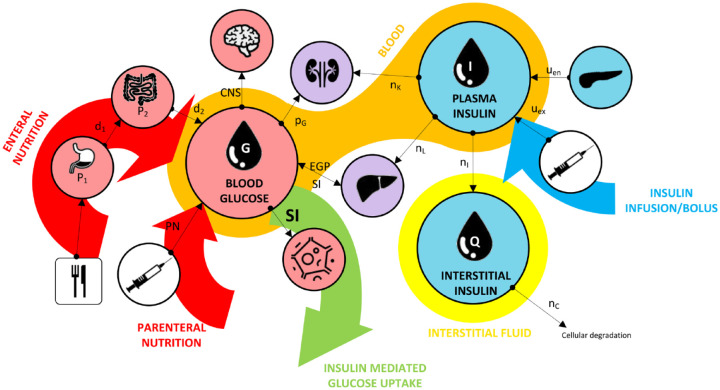
Figure 2.
Illustration of key dynamics of the glucose–insulin model, where key compartments include blood glucose, plasma insulin, and interstitial insulin.
Arrows show the direction of glucose flux.
Figure originally published by Uyttendaele et al. 30
CNS, central nervous system; EGP, endogenous glucose production; PN, parenteral nutrition; SI, insulin sensitivity.

