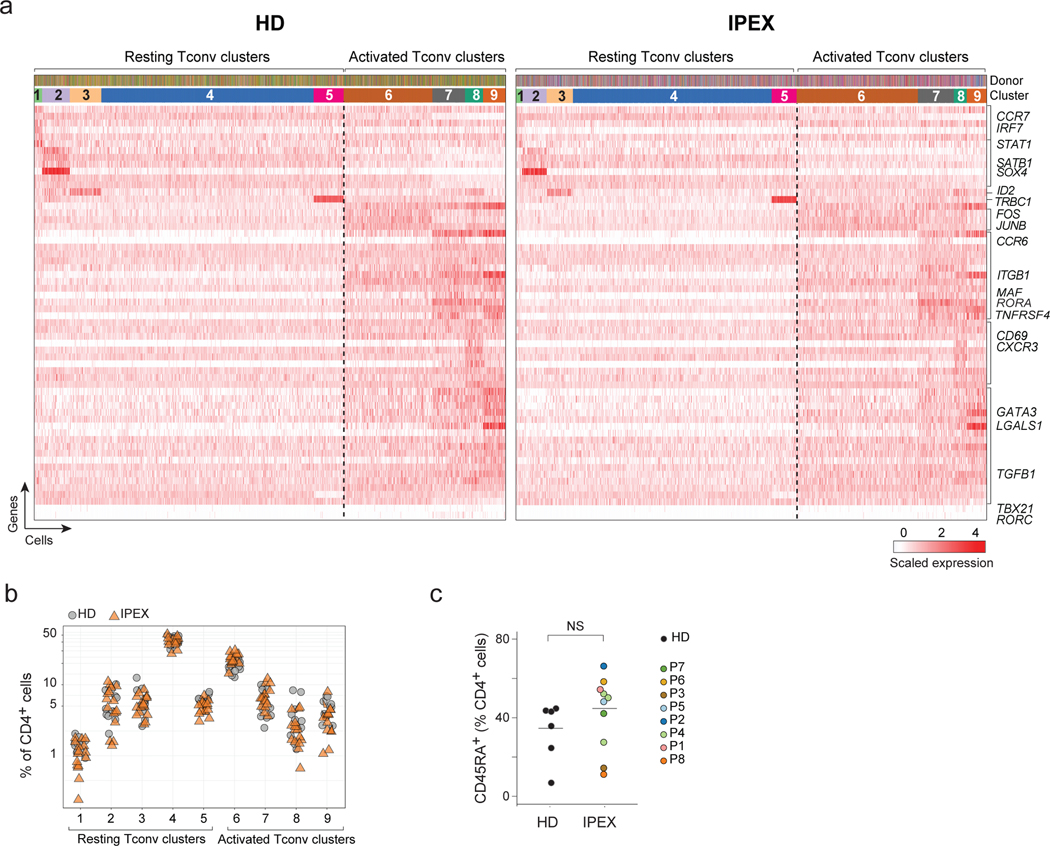
Fig. 4. Normal Tconv phenotypes in IPEX patients.
a. From the scRNAseq Tconv datasets (HD and IPEX combined), the IPEX signature was regressed out (see Methods) and biclustering was performed to define clusters in resting and activated Tconv. plotted as a heatmap for expression of the most characteristic genes for each Tconv cluster (each vertical line represents one cell). Top ribbons indicate donor origin and cluster annotations for every cell.
b. Proportion of resting and activated Tconv clusters in total CD4+ cells in HD and IPEX in scRNAseq data.
c. Proportion of CD45RA+ (resting) CD4+ T cells determined by flow cytometry in IPEX and HD. ns, non-significant (two-sided t.test, n= 11 HD, 11 IPEX).

