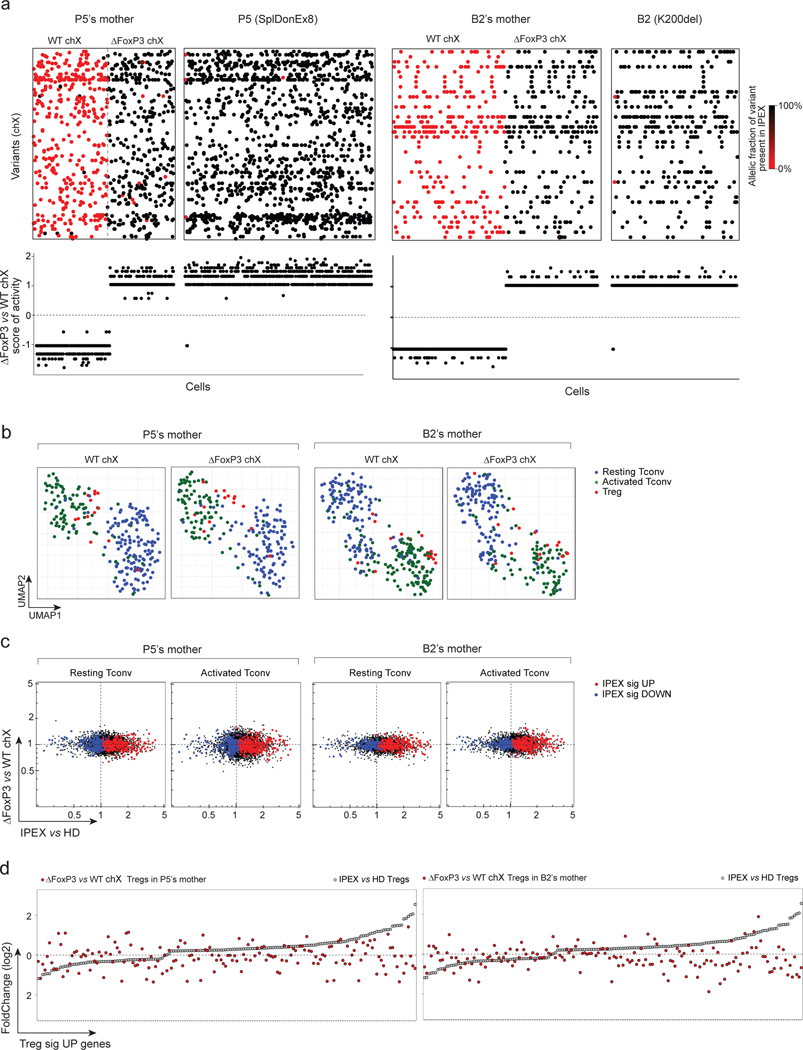
Fig. 6. Cell intrinsic and extrinsic effect of FOXP3 deficiency in Tregs and Tconvs of IPEX female carriers (mothers).
scRNAseq was performed on sorted and hashtagged blood CD4+ T cells from two IPEX mothers: P5’s and B2’s mothers (2,880 cells altogether)
a. Because of X inactivation in females a mix of FOXP3-deficient (ΔFOXP3) and -proficient (WT) T cells are present in IPEX mothers (left: P5’s mother, right: B2’s mother). Top: biclustering heatmap showing in each single cell (columns) the allelic fraction of X chromosome variants present in IPEX (P5 and B2) (carrying the FOXP3 mutation). Bottom: FOXP3-deficient vs -proficient X chromosome score of activity for each single cell.
b. 2D UMAP plot of all CD4+ cells from P5’s and B2’s mothers split by active X chromosome (left: FOXP3-proficient, right: FOXP3-deficient). Resting Tconvs, activated Tconvs and Tregs are highlighted in blue, green and red, respectively.
c. scRNAseq data for Tconv cells were collapsed, and expression ratio between FOXP3-deficient and -proficient Tconv (resting or activated) calculated for IPEX (x-axis) and in P5’s and B2’s mothers (y-axis). Up and down IPEX signatures genes in red and blue, respectively.
d. FC plots of FOXP3-deficient vs -proficient Treg in P5’s and B2’s mothers, Treg UP signature genes, ranked according to FC in IPEX vs HD (grey dots).

