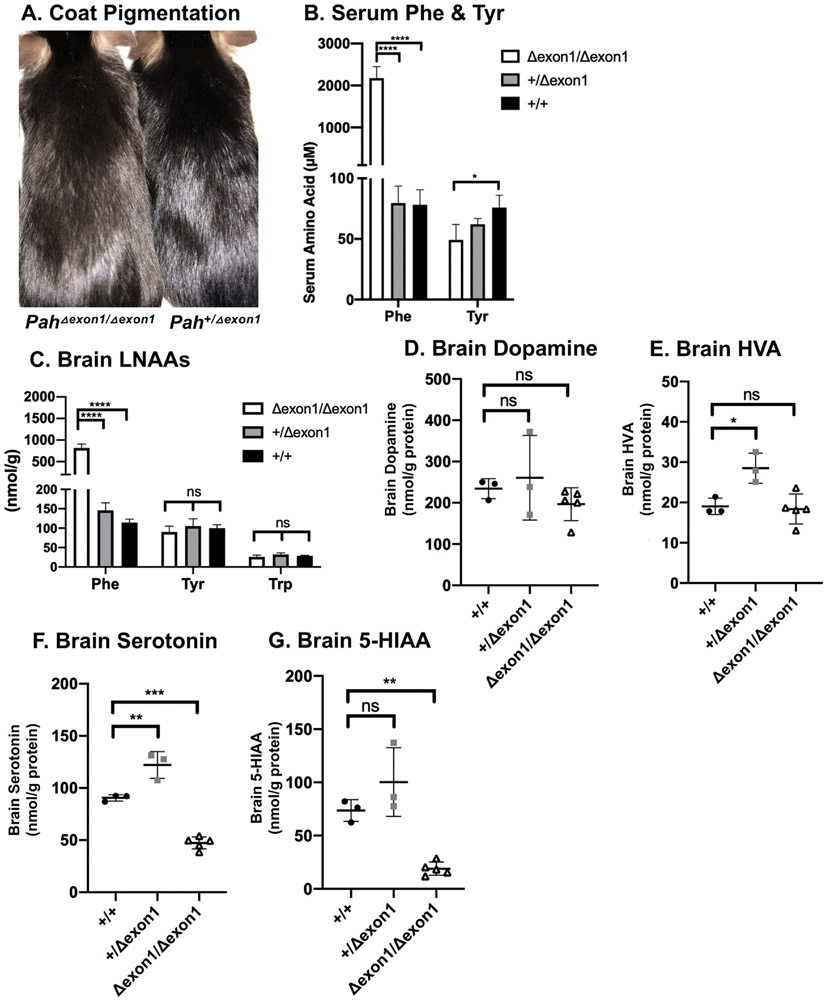
Fig. 2. Characterization amino acids & derivatives in PahΔexon1 mice.
A. Coat pigmentation. Photograph of untreated PahΔexon1/Δexon1 (left) and Pah+/Δexon1 (right) mice on standard mouse chow diet. B. Serum Phe & Tyr. Mean serum phenylalanine and tyrosine concentration ( ± SD) of adult PahΔexon1/Δexon1, Pah+/Δexon1, and Pah+/+ animals following euthanasia. The left y-axis indicates μM serum amino acid concentration. The average serum Phe was 2172 μM, 80 μM, and 78 μM, respectively. One-way ANOVA revealed significant effects of genotype on serum Phe (F (2,9) = 156.7, P < 0.0001). The average serum Tyr was 49 μM, 62 μM, and 75 μM, respectively. One-way ANOVA revealed significant effects of genotype on serum Tyr between PahΔexon1/Δexon1 and pah+/+ animals (F (2, 9) = 6.090, P = 0.0213). C. Brain LNAAs. Mean brain LNAA concentrations ( ± SD) of PahΔexon1/Δexon1, and Pah+/+ animals at time of euthanasia. The y-axis indicates amino acid concentration in nmol/g wet weight. The average brain Phe was 817 nmol/g, 146 nmol/g, and 114 nmol/g, respectively. One-way ANOVA revealed significant effects of genotype on brain Phe (F(2, 9) = 154.2, P < 0.0001). The average brain Tyr was 90 nmol/g, 105 nmol/g, and 100 nmol/g, respectively and brain Trp was 26 nmol/g, 32 nmol/g, 28 nmol/g, respectively. One-way ANOVA revealed no statistical differences in brain Tyr or Trp in PahΔexon1 allele mice. D. Brain dopamine. Brain dopamine concentrations in nmol/g protein (y-axis) of individual animals (represented as single points) in each genotype of PahΔexon1 allele mice (x-axis). There was no statistical significance in brain dopamine across genotypes by one-way ANOVA (F (2,8) = 1.129, P = 0.3700). E. Brain HVA. Brain HVA concentrations in nmol/g protein (y-axis) of individual animals (represented as single points) in each genotype of PahΔexon1 allele mice (x-axis). There was a significant difference in brain HVA across genotypes (one-way ANOVA F = [2,8] = 9.349, p = 0.0081) with post-hoc multiple comparisons showing a significant increase of HVA in heterozygous animals in comparison to WT animals (adjusted P = 0.016) but no difference between homozygous and WT animals (adjusted P = 0.9453). F. Brain serotonin in PahΔexon1 allele mice. Brain serotonin concentrations in nmol/g protein (y-axis) of individual animals (represented as single points) in each genotype of PahΔexon1 allele mice (x-axis). There was a significant difference in brain serotonin across genotypes (one-way ANOVA (F [2,8] = 91.20, P < 0.0001), with significantly less brain serotonin in PahΔexon1/Δexon1 animals (47.30 nmol/g protein) than wild type (90.53 nmol/g protein) or heterozygous (122.1 nmol/g protein) animals. G. Brain 5-HIAA. Brain 5-HIAA concentrations in nmol/g protein (y-axis) of individual animals (represented as single points) in each genotype of PahΔexon1 allele mice (x-axis). There was a significant difference in brain 5-HIAA across genotypes (one-way ANOVA: F [2,8] = 22.42, p = 0.0005), with less brain 5-HIAA in PahΔexon1/Δexon1 animals (18.95 nmol/g protein) than wild type (73.6 nmol/g protein) or heterozygous (100.3 nmol/g protein) animals.

