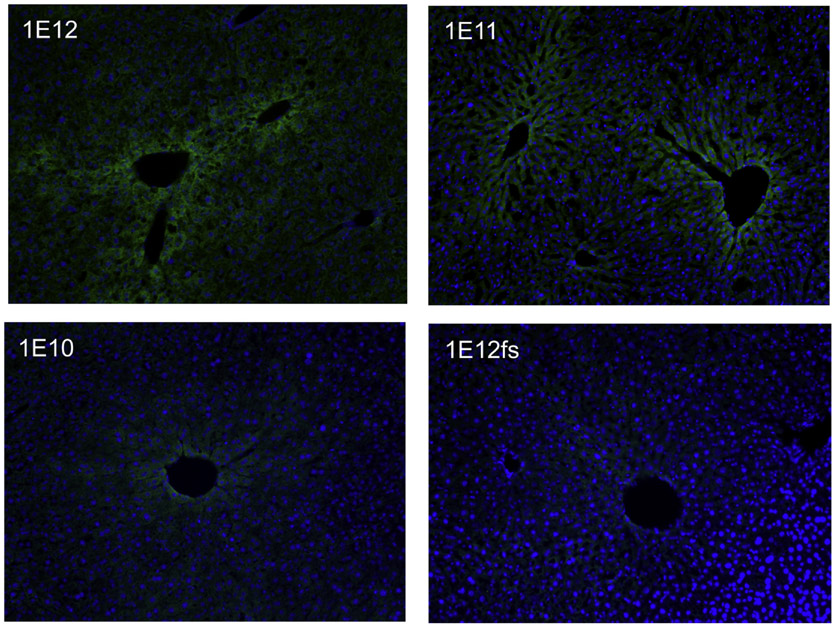
Fig. 4.
Liver PAH Fluorescent Immunohistochemistry of Gene Therapy Treated PahΔexon1/Δexon1 Mice. Anti-PAH fluorescent-immunohistochemistry in liver tissue samples from gene addition therapy treated PahΔexon1/Δexon1 mice. Green indicates the presence of PAH by anti-PAH antibodies bound by secondary antibodies conjugated with AlexaFluor 488 (green fluorescence) and blue indicates nuclear staining with DAPI. The four images display the gene therapy treated PahΔexon1/Δexon1 mice as labelled according to dosing of therapeutic vectors of LSPmPAH AAV2/8: 1 × 10¹² vg (top left image labelled with 1E12), 1 × 10¹¹ vg (top right image labelled with 1E11), and 1 × 10¹⁰ vg (bottom left image labelled with 1E10), followed by 1 × 10¹² vg of the control vector (LSPmPAHfs) containing a frameshift (bottom right image labelled with 1e12fs).

