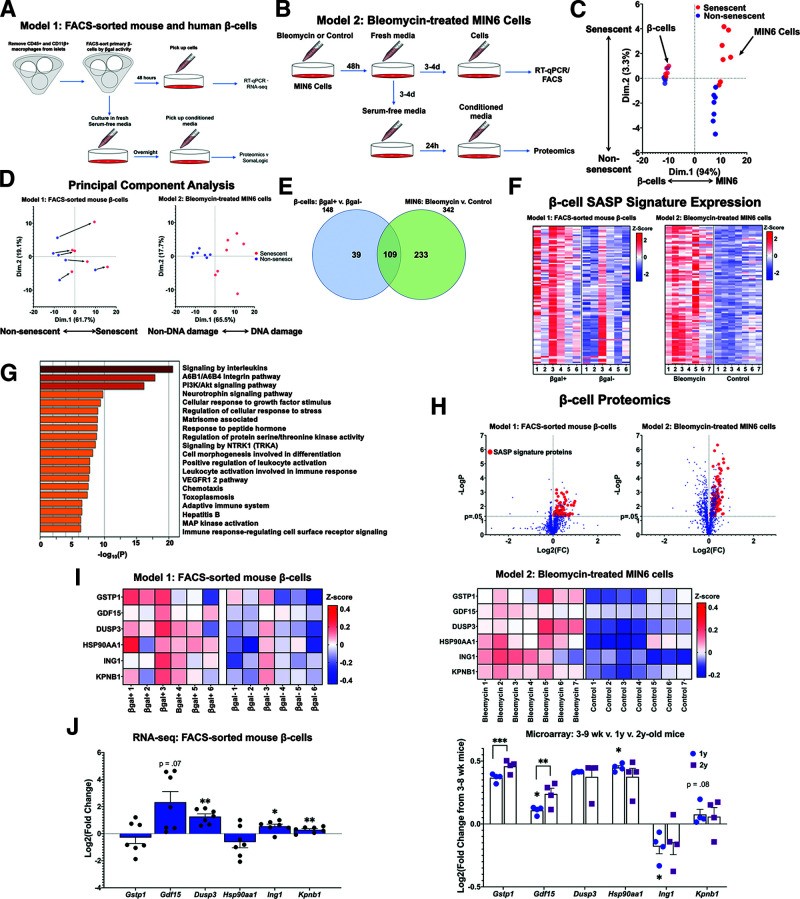
Figure 1.
The β-cell SASP signature included proinflammatory and stress response proteins. A: Workflow for sorting primary mouse and human β-cells into βgal+ and βgal− populations for gene expression and proteomic analysis. CM for proteomic analysis was generated using overnight culture of β-cells in serum-free islet media. B: Workflow for conducting gene expression and proteomic analysis of DNA-damaged MIN6 cells. CM for proteomic analysis was generated using 24-h culture of MIN6 cells in serum-free MIN6 media. C: PCA of proteomic data derived from CM from both models (A and B). Points were divided primarily based on cell type, but senescent cells clustered separately from nonsenescent cells as well. D: PCA of proteomic data divided into the two models of SASP generation. For both models, SASP-secreting cells differed consistently from their non-SASP–secreting counterparts. CM samples drawn from βgal-sorted β-cells (A) were paired, and CM samples from MIN6 cells (B) were unpaired. Bleomycin-treated and control MIN6 samples are referenced in this figure as “DNA damage” and “Non-DNA damage,” respectively. E: Venn diagram showing the number of proteins upregulated in each model of β-cell senescence. A total of 109 proteins were upregulated in both models of senescence, and these proteins were used to define the β-cell SASP signature. F: Heat maps showing relative expression levels of β-cell SASP signature proteins in each sample from both models. Expression levels are shown as z scores, and the midpoint of 0 represents average expression across all samples. G: Pathway analysis of β-cell SASP signature proteins. Inflammatory and stress-response pathways were significantly upregulated in senescent β-cells. H: Volcano plot showing Log2 fold change (FC) and −LogP of all proteins analyzed in SOMAscan analysis. β-Cell SASP signature proteins are shown as red points. I: Heat maps showing protein expression levels of six top SASP targets (GSTP1, GDF15, DUSP3, HSP90AA1, ING1, and KPNB1) in each sample from both models. Expression levels are shown as z scores, and the midpoint of 0 represents average expression across all samples. In model 1, samples were paired, and all six proteins were present at significantly higher concentrations in βgal+ CM. J: mRNA expression levels of top SASP targets in transcriptomic data. Based on RNA-seq data, most of the top SASP targets were transcriptionally upregulated in βgal+ β-cells. Based on microarray data from the β-cells of young, middle-aged, and old mice, most top SASP targets were also transcriptionally upregulated with chronological age. Results shown as mean ± SEM. For RNA-seq data: *0.011 < P < 0.028; ***0.0000054 < P < 0.00082. For microarray data: *0.023 < P < 0.038; **P = 0.0013; ***0.0000514 < P < 0.00017. d, days; wk, weeks; RT-qPCR, quantitative RT-PCR; v., versus.

