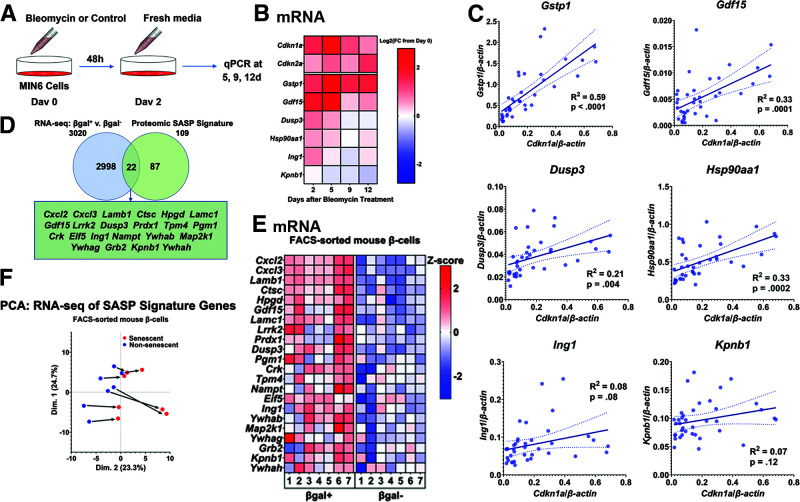
Figure 2.
β-Cell SASP expression levels were heterogeneous, but senescence induced a consistent shift in the β-cell secretome. A: Workflow of MIN6 senescence time-course experiments. Cells were treated with bleomycin for 2 days and then cultured in regular MIN6 media. Cells were collected at days 0, 2, 5, 9, and 12 for RNA isolation and RT-qPCR. B: Heat map showing expression levels at each time point of senescence genes (Cdkn1a and Cdkn2a) and top SASP targets in MIN6 cells. Expression of Cdkn1a, Gstp1, and Gdf15 increased significantly and peaked within 5 days of bleomycin treatment. Dusp3, Hsp90aa1, and Ing1 were transcriptionally upregulated to lower levels within 5 days, and expression of Kpnb1 declined by day 5. Expression levels are shown as the Log2 of the fold change (FC) from day 0 expression, and the midpoint of 0 represents a fold change of 1. Results were drawn from five total replicates across three separate experiments. C: Graphs showing expression levels of top SASP targets from individual samples across time points and their correlations with Cdkn1a expression. Gstp1, Gdf15, Dusp3, and Hsp90aa1 were all significantly associated with Cdkn1a expression. Expression levels of each gene varied considerably across samples. Lines of best fit are shown, along with dotted lines indicating their 95% CIs. P values were calculated using the null hypothesis that the slope of the best fit line equals 0. D: Venn diagram showing the number of genes significantly upregulated at the transcript level in βgal+ β-cells and the number of genes in the β-cell SASP signature. A total of 22 genes were upregulated at both the transcript level and protein level in senescent β-cells. Of the top SASP targets, Gdf15, Ing1, and Kpnb1 were upregulated both at the transcript and protein levels. E: Heat map showing transcriptional expression of the 22 genes upregulated in both the transcriptomic and proteomic analysis of senescent β-cells. βgal+ β-cells expressed these genes at significantly higher levels than βgal− β-cells. Expression levels are shown as z scores, and the midpoint of 0 represents average expression across all samples. Samples were paired, and all 22 genes were significantly transcriptionally upregulated in βgal+ cells. F: PCA of the RNA-seq samples using only the data from β-cell SASP signature genes. Samples varied on their starting point along the x-axis, but senescence generated a consistent rightward shift. d, days; qPCR, quantitative PCR; v., versus.

