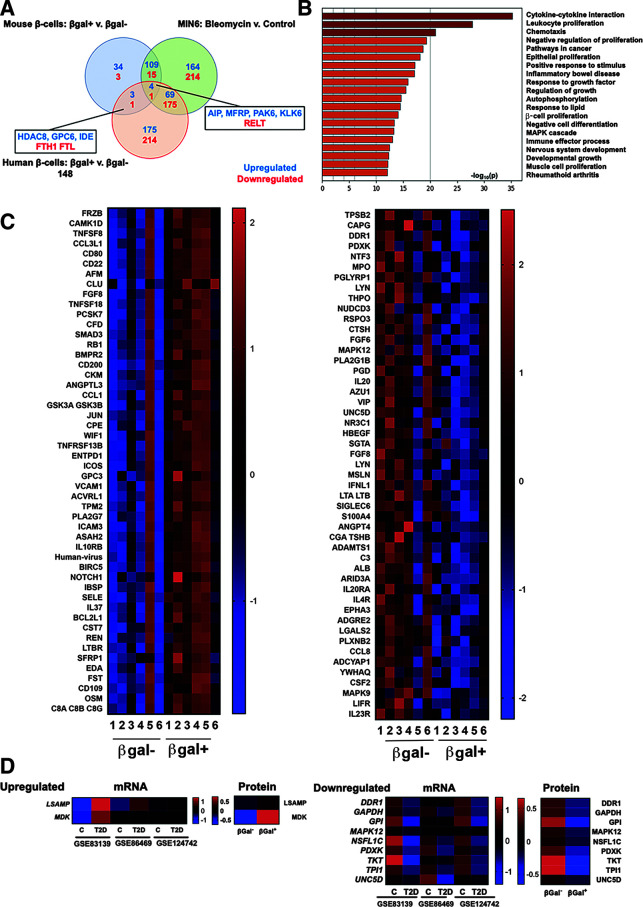
Figure 4.
Human SASP reveals conserved pathways and a subset of factors that coincide with β-cell transcriptional changes in T2D. A: Venn diagram showing the number of proteins upregulated and downregulated in each model of β-cell senescence. Five proteins overlapped in all three models, while four additional ones were shared between the human and mouse secretomes. B: Pathway analysis of human β-cell SASP signature proteins. The list of pathways was similar to that of senescent mouse β-cells. Inflammatory and stress-response pathways were significantly upregulated in human and mouse senescent β-cells; additionally, proliferative inhibition featured high on the human list. C: Heat maps showing protein expression levels of the 50 top upregulated and downregulated human SASP factors. Expression levels are shown as z scores, and the midpoint of 0 represents average expression across all samples. Samples were paired, and all proteins were significantly differentially expressed in βgal+ CM compared with its βgal− counterpart. D: Heat map showing expression levels of upregulated and downregulated genes in β-cells from donors with and without T2D that coincided with changes of SASP factors from senescent and nonsenescent human β-cells. Expression levels are shown as z scores. C, control (without diabetes); v., versus.

