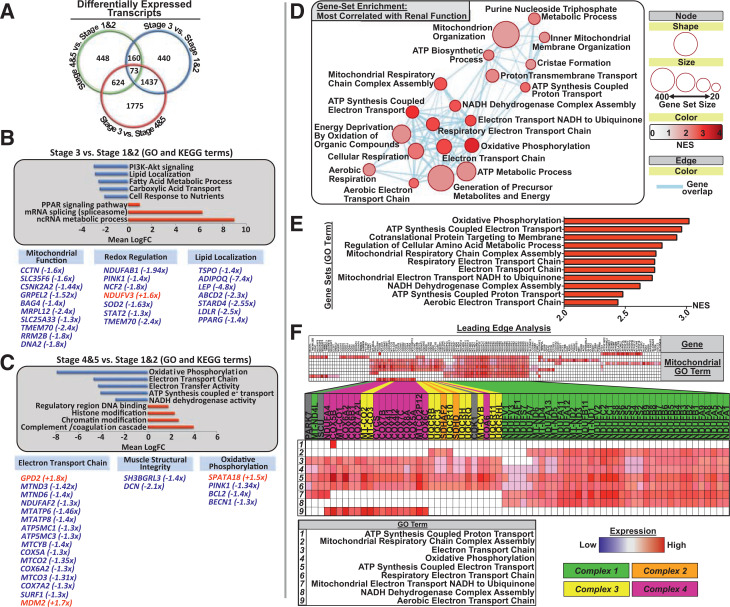
Figure 1.
Skeletal muscle transcriptome in CKD progression in T2DM: RNA sequencing output detailing overall transcript and gene regulatory network differences across CKD stages. A: Venn diagram comparing the number of significantly differentially expressed genes per condition (stages 4 and 5 vs. stage 1: 448 differentially expressed transcripts; stage 3 vs. stages 1 and 2: 440 differentially expressed transcripts; stage 3 vs. stages 4 and 5: 1,775 differentially expressed transcripts). B and C: Selected GO terms and KEGG pathways from a larger list of top 25 down- and upregulated gene networks across stage-wise transcript analysis. Bar charts depict top downregulated (blue bars) or upregulated (red bars) gene networks, with their accompanying network label listed next to its corresponding bar (all GO terms listed have FDR Q < 0.05, and all KEGG terms have P < 0.05). Pathway up- or downregulation is expressed in mean log fold change (LogFC) units and was determined to be significant when compared with background log2 fold change for genes not contained within the network/pathway. Beneath are selected genes from either significant GO or KEGG pathways or with known mitochondrial regulatory functions that are differentially expressed, and the fold change is listed in parentheses next to the gene term. B: Comparison of middle-stage (stage 3) CKD muscle transcriptome with stage 1 and 2 (early CKD is the reference). Metabolic pathways, including PI3K-Akt signaling, lipid handling and localization, and tricarboxylic acid cycle were significantly downregulated in middle-stage CKD compared with early-stage disease. C: Comparison of late-stage CKD with stages 1 and 2 (early CKD is the reference). Oxidative phosphorylation and mitochondrial ATP synthesis components were significantly downregulated in late-stage CKD compared with early, with specific genes listed at the bottom. D: Selected GSEA map depicting biological gene networks most strongly correlated with renal function (eGFR). Circles/nodes indicate biological gene network (node size = number of genes within the network; red scale = NES [0–4, increasing value indicates that the pathway is more strongly enriched/positively related with renal function]; blue lines = individual genes belonging to multiple gene sets [all FDR Q < 0.05]). E: Top biological gene networks most strongly related to renal function (top NES scores, all FDR Q < 0.01). These include networks with considerable overlap in regulating mitochondrial respiration and ETC complex function and assembly. F: LEA of top gene sets (E), highlighting individual genes driving the enrichment of mitochondrial regulatory networks in relationship to renal function. Individual genes driving this relationship are confined to ETC complex subunits and assembly factors, predominately of complex 1 and complex 4.

