Figure 2.
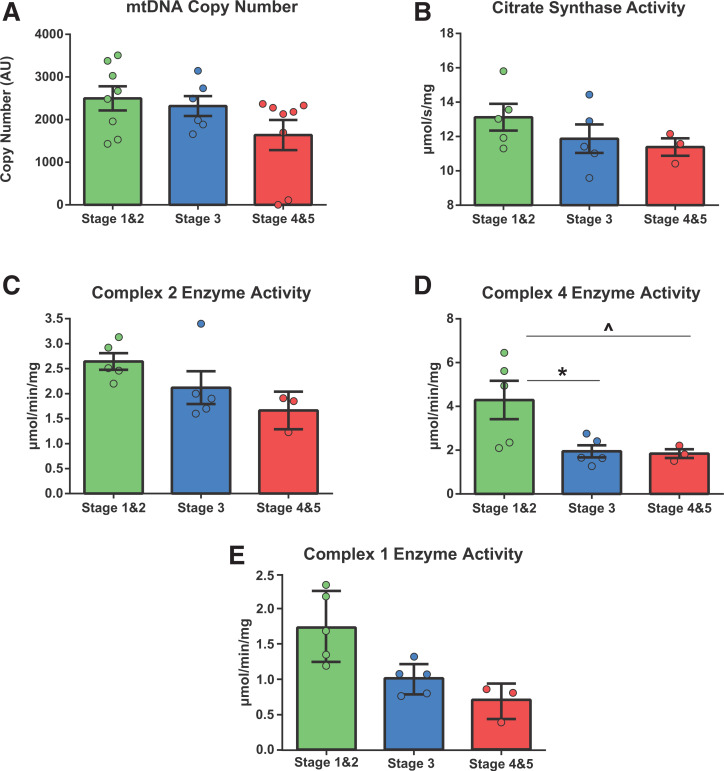
Mitochondrial enzymatic activity in CKD progression in T2DM: analysis of mitochondrial density, number, and ETC complex enzyme activity. A: mtDNA copy number (y-axis is unitless [one-way ANOVA F = 3, P = 0.07]) depicting no significant difference between CKD stage groups in mitochondrial abundance. B–D: The remaining analyses were performed on a 13-participant subset of samples (stages 1 and 2, n = 5; stage 3, n = 5; stages 4 and 5, n = 3). B: CS enzyme activity assessment. As in panel A, no significant differences were observed between groups (one-way ANOVA F = 1.2, P = 0.33). C: Mitochondrial ETC complex 2 (succinate dehydrogenase) enzyme activity, an assessment of complex 2–specific function in isolation. Although there appears to be a trend, there is no significant difference between CKD stage groups in complex 2 function (one-way ANOVA F = 3, P = 0.08). D: Mitochondrial ETC complex 4 (cytochrome oxidase) enzyme activity measured as in panel C (one-way ANOVA F = 5.1, P = 0.02). E: Mitochondrial ETC complex 1 (NADH) enzyme activity (one-way ANOVA F = 3.9, P = 0.06). *P < 0.05, post hoc test differences between stages 1 and 2 and stage 3; ^P < 0.05, post hoc test differences between stages 1 and 2 and stages 4 and 5. AU, arbitrary unit.

