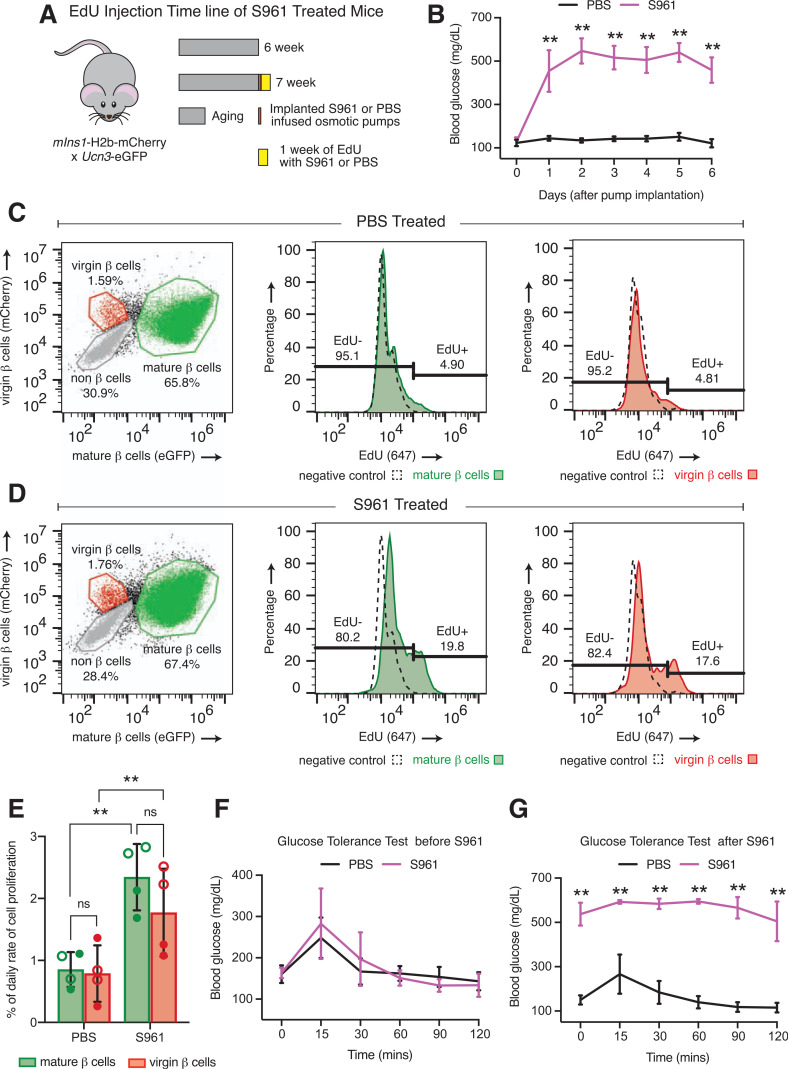
Figure 5.
Virgin β-cell proliferation increases similarly to mature β-cell proliferation in response to insulin resistance. A: Schematic of EdU administration timeline of PBS- or S961-treated mIns-H2b-mCherry × Ucn3-EGFP mice. B: Daily blood glucose measurement of random-fed PBS- and S961-treated mice. Dot and histogram plots of flow data illustrating the percentage of EdU-positive and EdU-negative virgin and mature β-cells of PBS-treated (C) and S961-treated (D) mice. E: Quantification of the daily proliferation rate of mature (green bars) and virgin (red bars) β-cells between PBS- and S961-treated mice (n = 4 per group). Open circles, females; closed circles, males. Data were analyzed by two-way ANOVA corrected for multiple comparisons with the Tukey method for statistical significance. Glucose tolerance test before S961 treatment (F) and after S961 treatment (G). Data were analyzed by Mann-Whitney test for statistical significance. All error bars represent ± SD. **P < 0.01. mins, minutes; ns, not significant.

