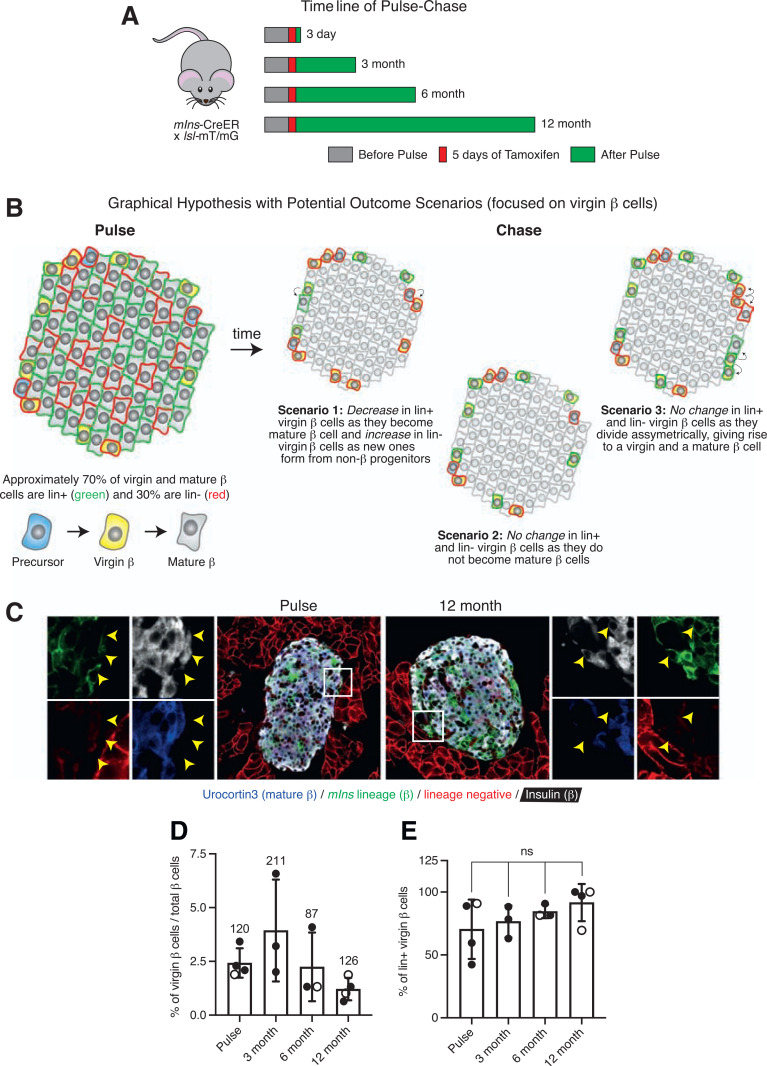
Figure 6.
Virgin β-cells represent a stable, slowly maturing subpopulation of β-cells. A: Schematic of tamoxifen gavage timeline of mIns-CreER × lsl-mT/mG mice for pulse-chase experiment. B: Graphical hypothesis illustrating three possible outcomes from pulse-chase experiment with a focus on the changes in the fraction of lineage-labeled virgin β-cells. In scenario 1, the fraction of lineage-positive virgin β-cells decreases as these cells develop into mature β-cells and the fraction of lineage-negative virgin β-cells increases as new virgin β-cells form from non-β cells (precursors, α-cells, δ-cells, ductal cells, etc.). In scenario 2, virgin β-cells do not mature within the 12-month chase period and thus the fraction of lineage-labeled virgin β-cells remains the same. In scenario 3, the fraction of lineage-labeled virgin β-cells also stays the same, as virgin β-cells act stem cell–like and divide asymmetrically, self-renewing the virgin β-cell pool while yielding daughter cells that mature. C: Representative immunofluorescence images of islets from a mouse in the pulse cohort and a mouse in the 12-month chase cohort stained with insulin (blue) and Ucn3 (white) to discern between virgin and mature β-cells. D: Quantification of the fraction of virgin β-cells across pulse and chase (3, 6, and 12 month) cohorts (n ≥ 3 mice per group). Values above each bar indicate the total number of virgin β-cells counted per cohort. E: Quantification of the average percentage of lineage-labeled virgin β-cells among pulse and chase cohorts (n ≥ 3 mice per group). Open circles, females; closed circles, males. Data were analyzed for statistical significance by Kruskal-Wallis test, corrected for multiple comparisons with the Dunn test. Error bars represent ±SD. ns, not significant.

