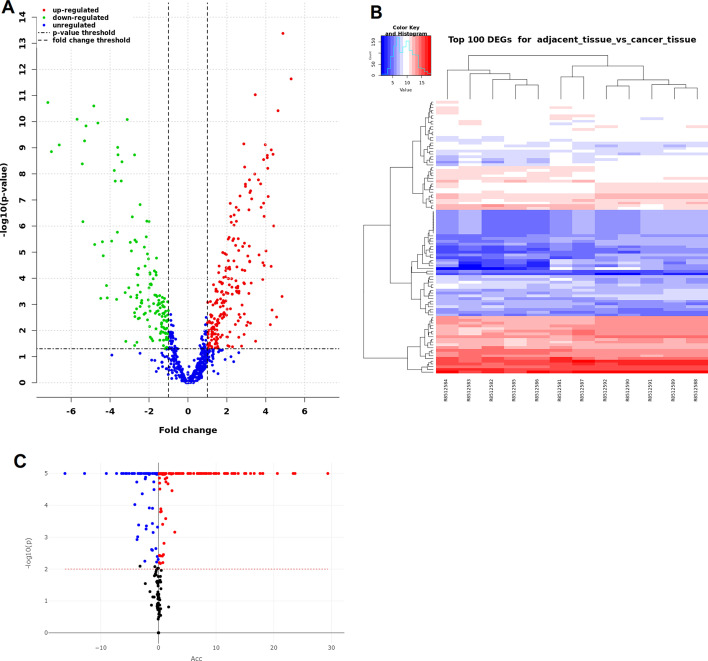
Fig. 3.
Volcano plots and heatmap of dysregulated small ncRNAs and impacted pathways. (A) This figure shows a volcano plot generated by RNAdetector in its final report with the up-regulated (red) and down-regulated (green) small ncRNAs identified after the comparison between CRC samples vs adjacent normal tissue samples. A volcano plot combines the results of a statistical test with the magnitude of the change enabling quick visual identification of those genes that display large-magnitude changes that are also statistically significant. The horizontal dashed line indicates the threshold for statistical significance, while the vertical dashed lines are the thresholds for biological significance. (B) This figure shows a heatmap generated by RNAdetector with the top 100 differentially expressed small ncRNAs. The top 100 deregulated small ncRNAs were selected for their statistical significance in terms of smaller adjusted p-value. Also with the top 100 deregulated small ncRNAs, CRC and normal tissue samples form two distinct clusters (samples are named with their SRR identifiers). (C) This figure shows a volcano plot generated by RNAdetector in its pathway analysis report with the significantly impacted pathways. All significantly impacted pathways are represented in terms of their measured accumulation (x-axis) and the significance (y-axis). The dotted lines represent the thresholds used to select significantly impacted pathways. Significantly impacted pathways with positive accumulation are shown in red, while the negative ones in blue

