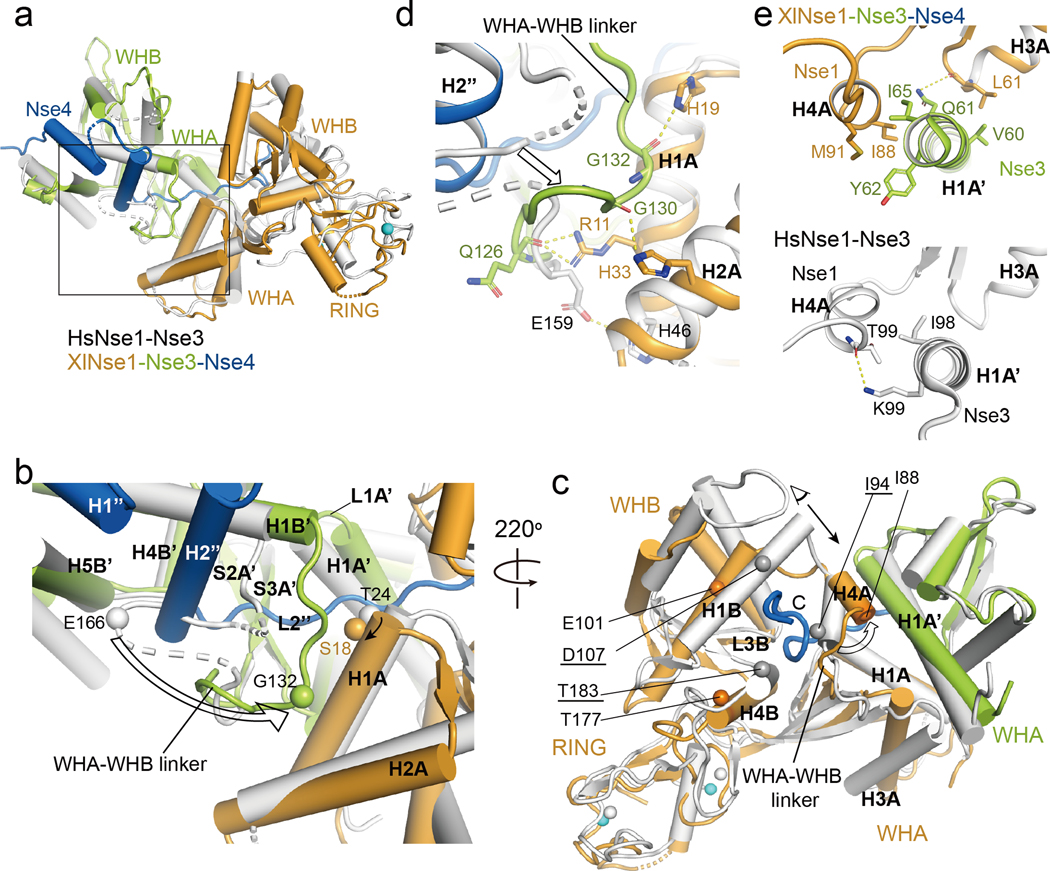
Fig. 2.
Structural comparison of the XlNse1-3-4 and the HsNse1-Nse3 complex.
(a) XlNse3 (green) of the Nse1-3-4 complex is aligned with HsNse3 (white) of the Nse1-Nse3 complex (PDB 3NW0) [29]. XlNse1 and XlNse4 are colored orange and blue, respectively.
(b) Close up view of the box in (a). Binding of the H2” helix and the L2” loop of Nse4 to Nse1-Nse3 results in the shift of the Nse3 WHA-WHB linker toward the H1A helix of Nse1. Ser18 and Gly132 of Nse3 (Thr24 and Glu166 in HsNse3) shown in spheres illustrate the conformational change of the H1A helix of Nse1 and the WHA-WHB linker of Nse3, respectively (indicated by an arrow).
(c) Binding of the extended L2” loop of Nse4 (blue) induces conformational changes in Nse1 (orange). The HsNse1-3 complex is colored white. Selected residues are shown in spheres to highlight the conformational changes of Nse1. Gray and orange spheres represent the residues of Hs and XlNse1, respectively. White and cyan spheres indicate the zinc ions of HsNse1 and XlNse1, respectively. HsNse1 residues corresponding to those of XlNse1 are underlined. Conformational change of the H4A helix is shown with an empty arrow. A black arrow indicates a view for the figure (e).
(d) Close-up view of (b) showing the new interface formed between the WHA-WHB linker of XlNse3 (green) and the H1A and H2A helices of Nse1 (orange). HsNse1-Nse3 complex is colored in white.
(e) Close-up view of (c) in a different angle. The H4A helix of Nse1 shifts toward the H1A’ helix of Nse3, which increases the interface between the H4A helix of Nse1 (orange) and the H1A’ helix of Nse3 (green, top) compared with that of HsNse1-Nse3 (white, bottom).

