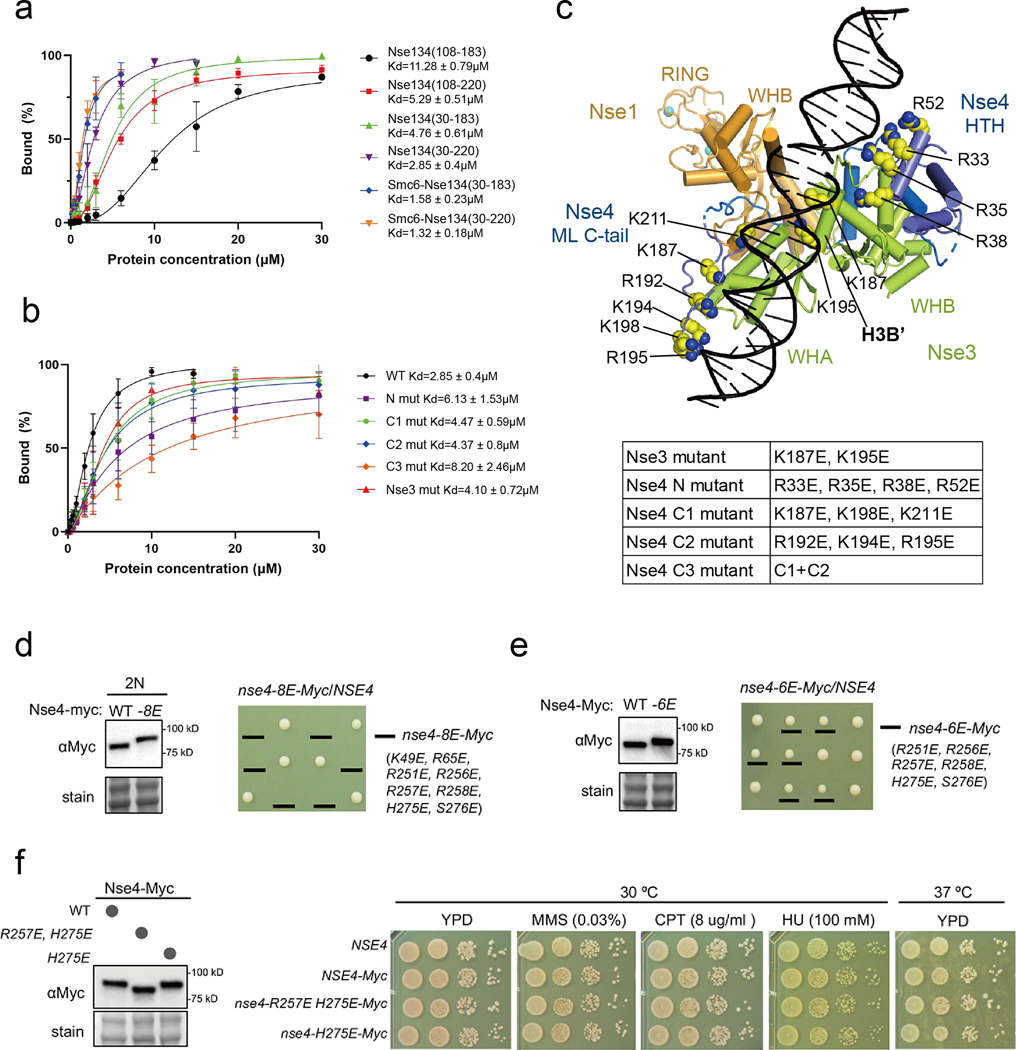
Fig. 6.
DNA-binding affinities and cell viability test of various XlNse1-3-4 complex proteins.
(a) Quantification of bound DNA in the Nse1-3-4 complex using various constructs of Nse4 described in Fig. S8a. The amount of bound DNA in the presence of increasing amounts of protein was quantified using ImageJ [54]. Error bars were calculated from three independent experiments.
(b) Quantification of bound DNA in the Nse1-3-4 complex using mutants of Nse3 or Nse4 described in Fig. S8b.
(c) A model of DNA-bound Nse1 (orange)-Nse3 (green)-Nse4 (blue) complex. The N- and C-terminal regions (residues 30 to 104 and 187 to 211) of Nse4 are positioned near the DNA. All residues in Nse3 and Nse4 mutated for EMSA experiments are shown as yellow spheres.
(d) The nse4–8E mutant is inviable. (left) The nse4–8E mutant protein was expressed at wild-type levels. Diploid cells (2N) containing one copy of wild-type untagged Nse4 and another copy of Myc-tagged Nse4, either wild-type (WT) or mutated (−8E), were examined. Protein samples were prepared from asynchronous cultures. Ponceau S stain (Stain) was used for equal loading control. (right) Examples of tetrad analyses from indicated diploid strain. Spore clones were grown at 30 ºC for 2 days and genotyped.
(e) The nse4–6E mutation does not affect protein levels but leads to slow growth on dissection plate. Data are presented in as in panel (d).
(f) The nse4-H275E or –R257E, H275E mutant shows normal growth and genotoxic resistance. (left) Data are presented as the left panel in (d). (right) nse4-H275E or –R257E, H275E cells exhibit wild-type levels of growth at 30 ºC or 37 ºC. Both mutants were resistant to indicated genotoxins. 10-fold serial dilution of cells were spotted on plates and growth was assessed after incubation for 2 days.

